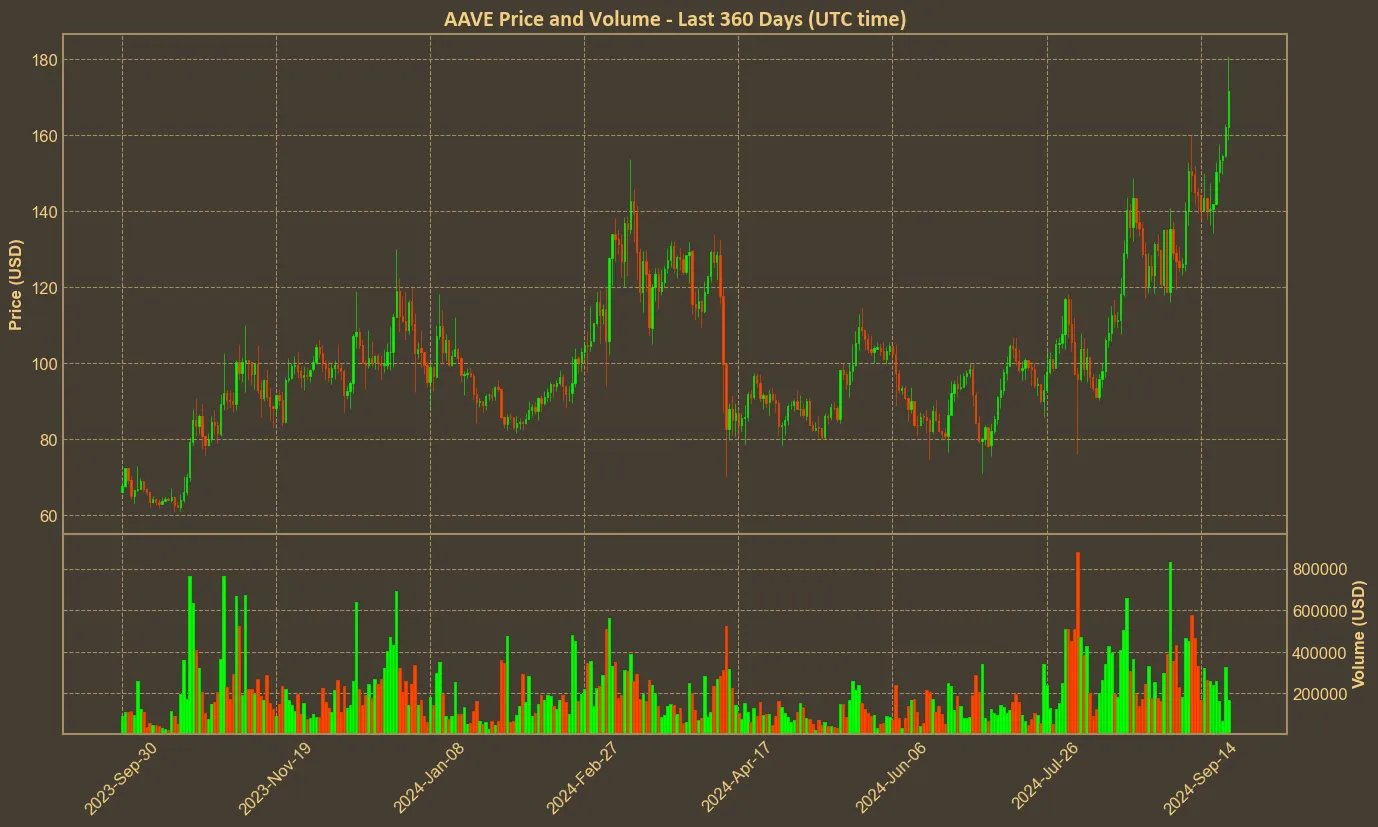
The recent performance of Aave (AAVE) on the cryptocurrency market has been nothing short of impressive. Ranked #38 among cryptocurrencies, AAVE currently trades at $171, boasting a robust market cap of $2.56 billion. The price has seen a substantial increase over the last quarter, soaring by 88%, and an eye-popping 173% rise over the past year. This upward trajectory indicates growing investor confidence and substantial market activity around the DeFi lending protocol.

Strong Bullish Indicators
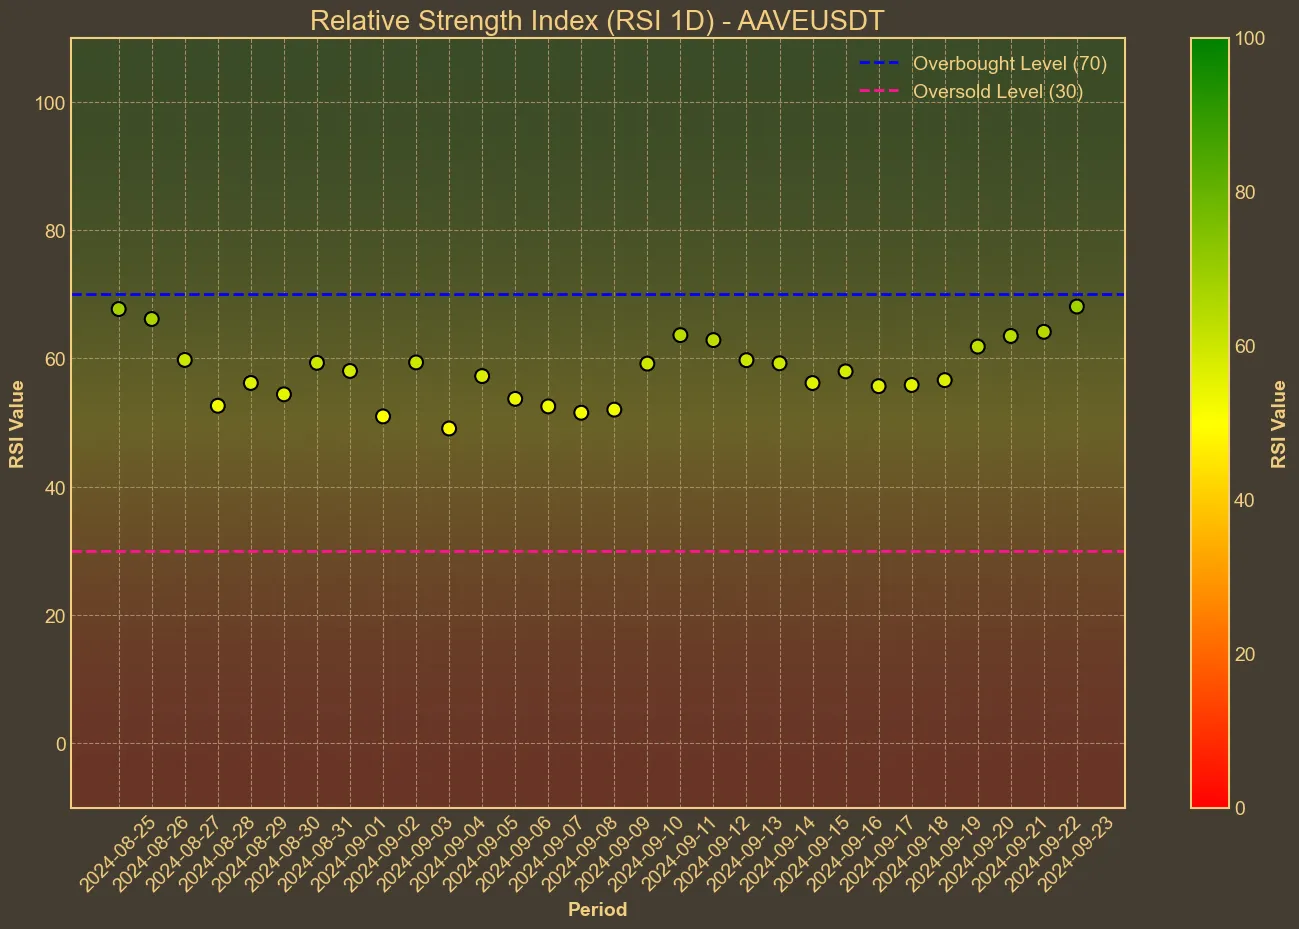
Analyzing the technical indicators, several bullish signals stand out. The Relative Strength Index (RSI), a momentum oscillator, has climbed to 72 today from 56 a week ago, suggesting an overbought condition. This rapid increase in RSI typically signals strong buying momentum but also warrants caution as it warns of potential overvaluation.

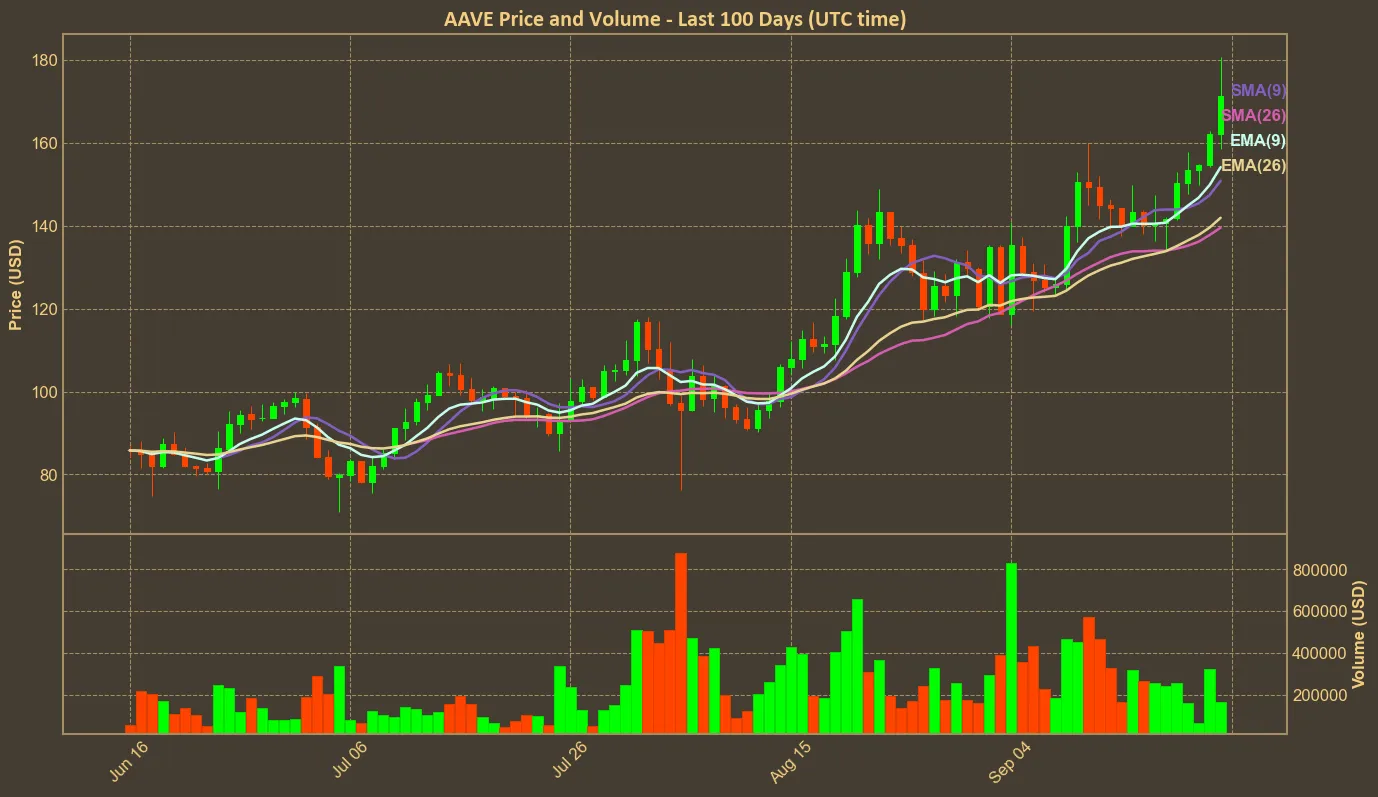
Meanwhile, the Simple Moving Average (SMA) and Exponential Moving Average (EMA) have both demonstrated an upward trend, with the SMA reaching 140 and the EMA 142, consistent over the last week.

The Bollinger Bands (BB) show the price hovering near the upper band (BB_H: 167.0), which often indicates that the asset is trading at a high volatility level. The Moving Average Convergence Divergence (MACD) is another bullish indicator, with the MACD value at 9.0 compared to the signal line at 7.0, pointing towards a continued upward trend. Moreover, the Awesome Oscillator (AO) reflects strong bullish momentum, rising from 14 a week ago to 19 today.
The market volume data further supports the bullish case. The volume has surged dramatically, registering a 37% increase over the last day, and a staggering 134.5% rise over the past week. High transaction volumes often confirm a strong price trend, indicating ample liquidity and investor enthusiasm.
Potential Risks and Considerations
Despite these promising trends, it’s important to consider the inherent limitations of technical analysis. Market conditions can rapidly change, and technical indicators are not foolproof. While the significant rise in price and volume may suggest continued bullish momentum, high volatility and the overbought RSI call for cautious optimism. Investors should be mindful of potential corrections and have a risk management strategy in place.
In summary, Aave has shown strong bullish indicators supported by substantial market activity. However, the technical indicators also suggest that the asset may be reaching an overbought condition. While the general sentiment remains positive, and reaching $200 in upcoming days is not out of the picture, potential investors should exercise caution and monitor RSI indicator.


