Hedera Hashgraph (HBAR) continues to gain attention after a strong few weeks. After a tough first quarter, HBAR’s recent price action shows signs of recovery. The token is now priced at $0.197, up over 15% from last week and over 14% on the month. At the same time, trading volume and market cap are climbing again.
However, when zooming out, it’s still down nearly 38% from the previous quarter, not fully recovered after the tariff war. And while the recent movements look positive, technical indicators reveal a mixed picture that calls for some caution.
Table of Contents
Click to Expand
Momentum Indicators
RSI: Close to Overbought
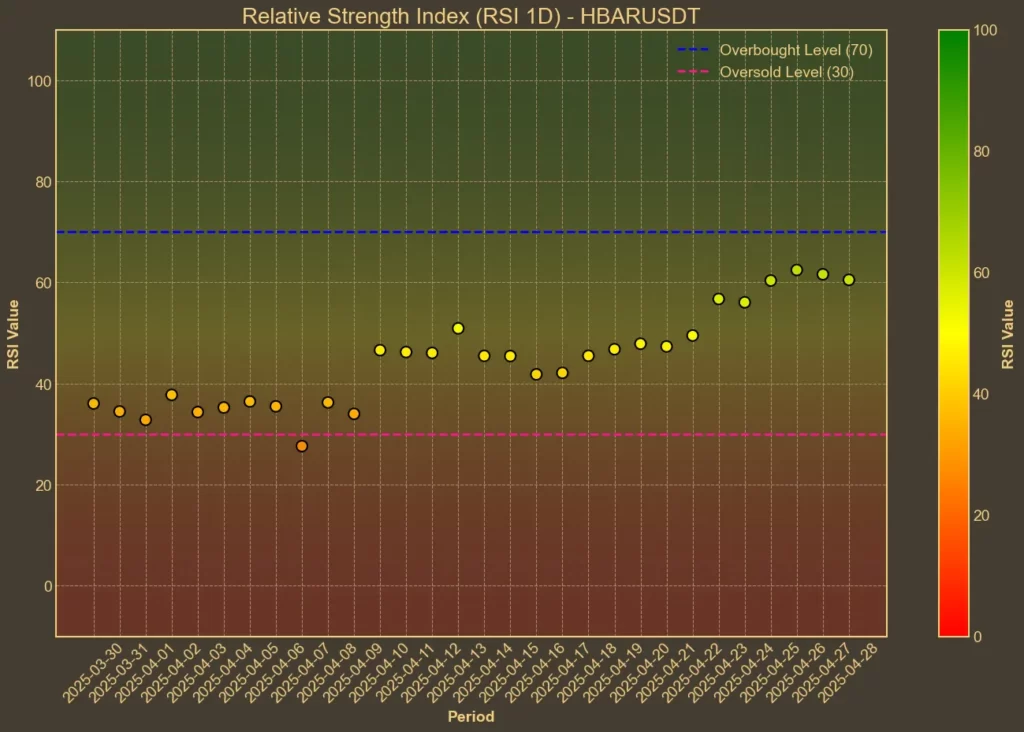
The Relative Strength Index (RSI) tracks whether an asset is overbought or oversold. HBAR’s RSI(14) sits at 64, up from 61 yesterday and 49 a week ago. The short-term RSI(7) jumped to 79 from 73, signaling that HBAR may be running hot. In short timeframes, this often leads to a pause or pullback.
MFI: Overbought
The Money Flow Index (MFI) adds volume into the RSI formula. Today’s MFI(14) reads 74, compared to 64 yesterday and 63 a week ago. This suggests that the recent buying has been aggressive, and we are now approaching levels where reversals can happen.
Fear & Greed Index: Neutral
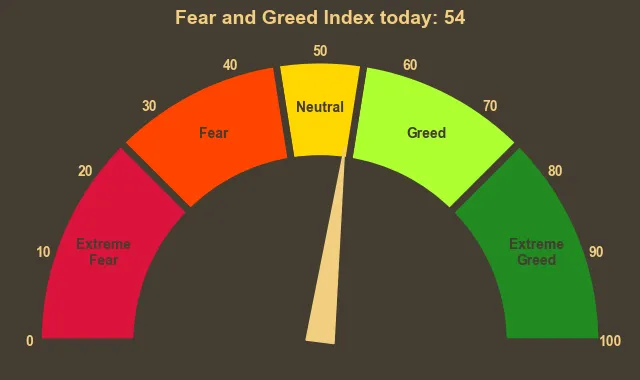
The broader crypto Fear & Greed Index shows the overall market mood, not just HBAR. Today’s value is 54, neutral but leaning slightly toward greed. It’s a soft warning that emotions are heating up again, but not yet at extreme levels.
Moving Averages
SMA & EMA: Bullish
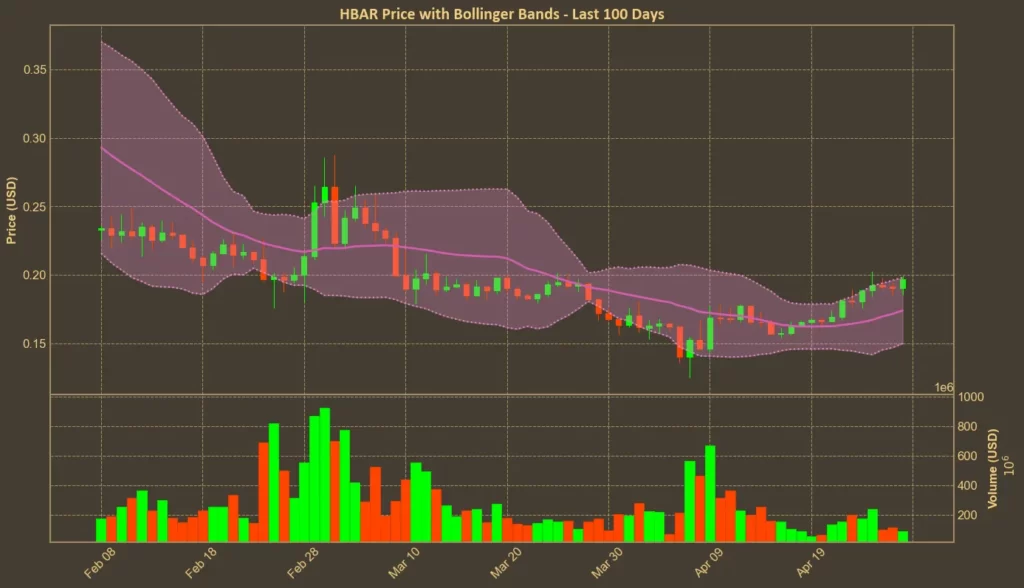
Simple and Exponential Moving Averages (SMA and EMA) help track trend direction. HBAR is trading above both short-term and mid-term averages: the SMA(9) is 0.1841, and the EMA(9) is 0.1855, both below the current price. Longer-term averages SMA(26) at 0.1694 and EMA(26) at 0.1778 also remain supportive. This structure favors further upside if buying momentum holds.

Bollinger Bands: Increased Volatility
Bollinger Bands show expected volatility and breakout potential. HBAR is close to the upper band at 0.198, while the lower band is at 0.1498. Being near the top suggests possible overextension in the short term, but also that bullish pressure remains strong for now.
Trend & Volatility Indicators
ADX: Weak Trend
The Average Directional Index (ADX) measures trend strength. HBAR’s ADX(14) sits at 20, the same as yesterday and slightly down from 22 a week ago. That suggests that while the price is rising, the overall trend is not yet very strong.
ATR: Stable Volatility
The Average True Range (ATR) measures daily price movement ranges. ATR(14) is at 0.0128, roughly stable over the past week. It indicates that volatility hasn’t exploded yet despite price gains.
AO: Bullish
The Awesome Oscillator (AO) tracks short-term and long-term momentum shifts. AO today is 0.0191, compared to 0.0172 yesterday and -0.0063 a week ago. This confirms bullish momentum is picking up.
VWAP: Bullish
The Volume Weighted Average Price (VWAP) today is 0.2295, notably higher than the current market price. This suggests there could still be room for upward movement, but also warns that many recent buyers are already slightly ahead in profit.
Relative Performance
Comparison Against XRP: Rising
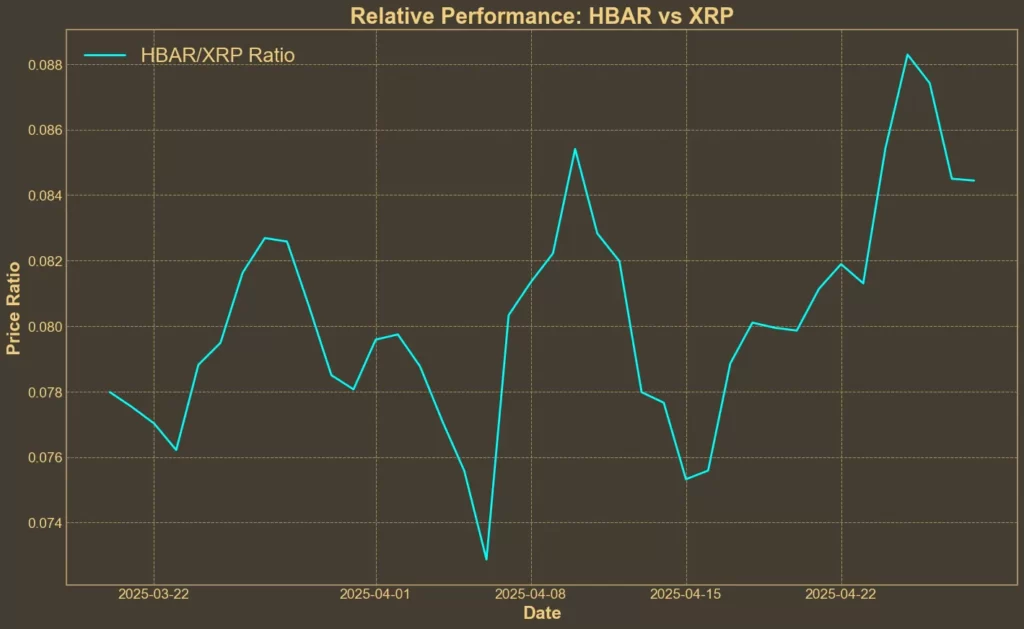
The HBAR/XRP ratio is currently 0.0845. It has risen by about 4.2% over the past 7 days and nearly 7.7% over the last 30 days. HBAR is outperforming XRP recently, strengthening its relative position.
Final Thoughts
Technical indicators for Hedera suggest a short-term overbought condition, but a medium-term recovery trend is building. Moving averages and oscillators look healthy, but volatility is rising. While the price action is encouraging, we should remember that technical analysis alone cannot predict external events like ETF approvals, institutional adoption or trade war developments.
The overall picture is moderately bullish but fragile. HBAR bulls seem to be in control for now, but the lack of strong trend confirmation and rising overbought signals mean that chasing the rally without a strategy would be risky.
Read also: Raydium LaunchLab vs Pump.fun: How Do They Compare?


