Kadena (KDA) has faced challenges in recent months. For most of 2024, it remained stuck around the $0.50 range. Although it briefly surged above $1.80 following Donald Trump’s victory in the U.S. presidential election, the rally was short-lived, and the price quickly dropped back down.
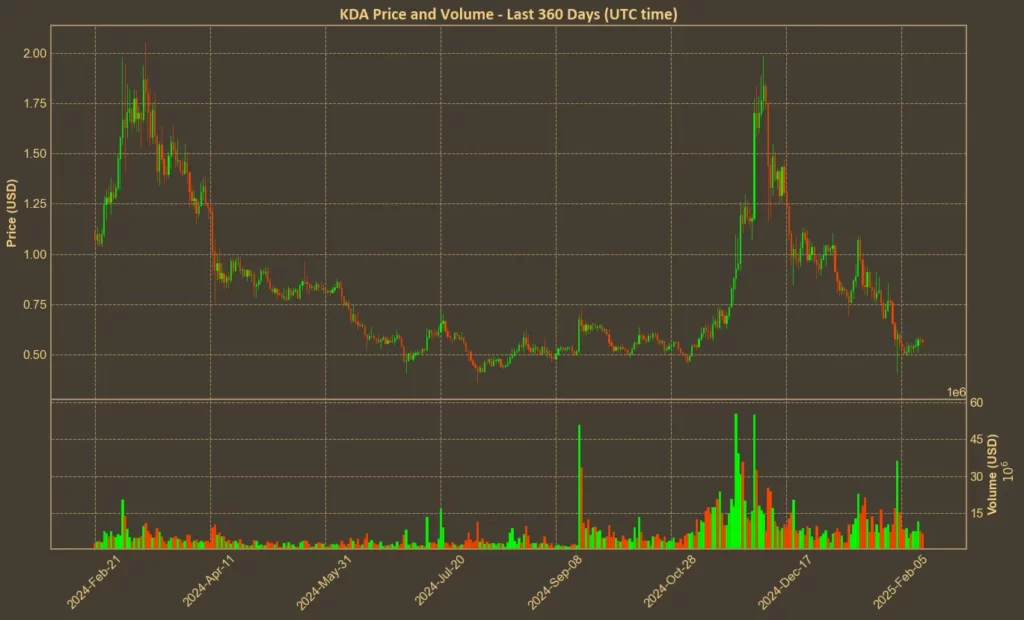
Over the past month, KDA has declined by over 30%, showing significant weakness. However, recent indicators suggest a possible stabilization. Does this coin still have potential in 2025? In this article, we will explore what Kadena offers and analyze key technical indicators to assess whether a comeback is on the horizon.
Table of Contents
What is Kadena (KDA)?
The easiest explanation would be that Kadena is a scalable version of Bitcoin, designed to process transactions faster while maintaining the security of Proof-of-Work. It’s cofounders were the creators of first JP Morgan blockchain.
Unlike Bitcoin, which operates on a single chain and handles only few transactions per second, Kadena uses Chainweb, a multi-chain system that runs parallel chains to increase speed and efficiency. This allows Kadena to theoretically process up to 480,000 transactions per second, solving Bitcoin’s scalability problem without sacrificing decentralization.
Another important aspect is Pact, Kadena’s smart contract language. While Bitcoin lacks smart contract functionality and Ethereum’s Solidity is prone to security flaws, Pact is human-readable and self-auditing, making it both safer and easier to use.
The network is powered by KDA, its native token, used for transactions and miner rewards. Kadena offers a gas station model, allowing businesses to cover transaction fees for users, making blockchain adoption more accessible. Unlike Bitcoin, KDA does not have halving events – instead, mining rewards decrease linearly over time.
If you are interested in what coins other than Bitcoin have halvings, check out this article!
Kadena Price Action In The Past
In November 2021, Kadena peaked with a market cap exceeding $3 billion, nearly breaking into the top 50 cryptocurrencies. At its all-time high, KDA was valued at $28.
However, the surge was short-lived. Over the following year, the token’s price collapsed to around $1 and has struggled to break even past $2 since then.
Currently, Kadena remains a niche project, with a market cap of approximately $170 million, placing it in the lower end of the top 300 cryptocurrencies. Its current price of $0.56 is a fraction of its former glory. That said, KDA is still listed on major exchanges like Binance, Bybit, and OKX, ensuring some level of liquidity and relevance.
Despite its struggles, the development of the project continues, with a recent hard fork launched less than two weeks ago. Can Kadena reclaim its previous highs – or at least recover above $1? We analyzed key technical indicators to find out.
Momentum Indicators
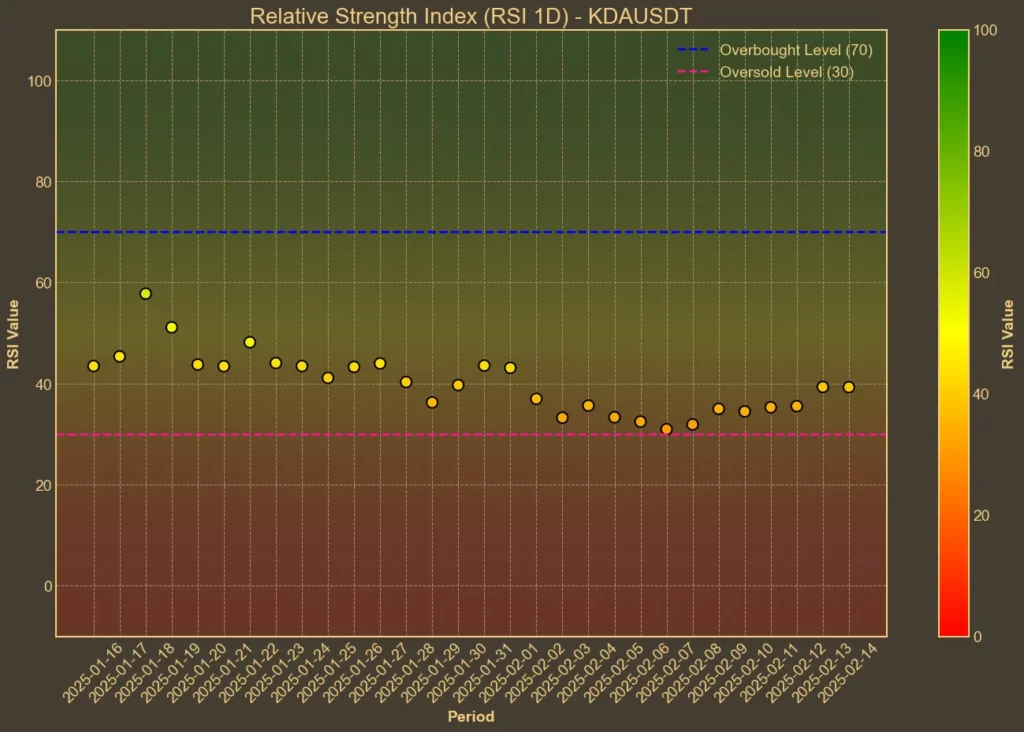
RSI: Neutral
The Relative Strength Index (RSI) is currently at 39, indicating that KDA is approaching oversold territory but not yet there. A neutral RSI suggests that the coin neither faces immediate upward pressure nor is it excessively undervalued.
MFI: Stable
The Money Flow Index (MFI) is at 44, showing balanced buying and selling activity. This stability in the MFI reinforces the current neutral sentiment surrounding KDA.
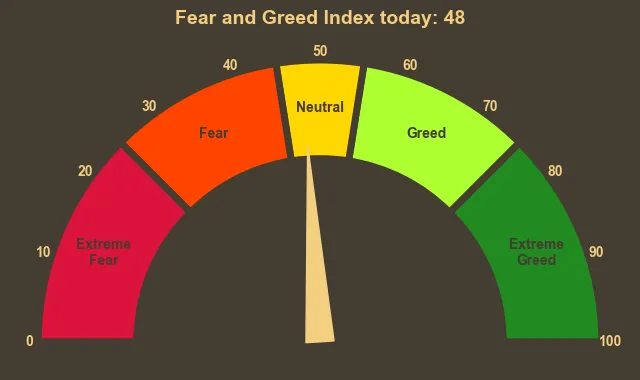
Fear & Greed Index: Neutral
With a Fear & Greed Index value of 48, the overall crypto market sentiment remains balanced. The slight decrease from previous days indicates a cautious but hopeful outlook among investors.
Moving Averages
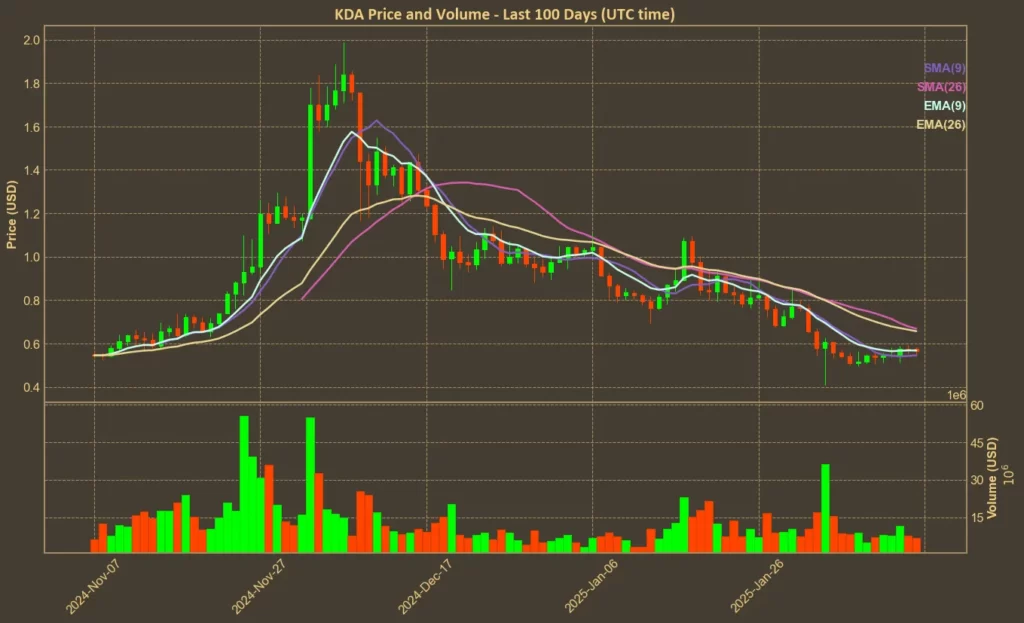
SMA & EMA: Mixed Signals
KDA’s Simple Moving Averages (SMA) and Exponential Moving Averages (EMA) present mixed signals. The SMA(9) is below the EMA(9), while the SMA(26) is higher than the EMA(26), suggesting that short-term trends are weak, but there might be underlying support from longer-term averages.
Bollinger Bands: Room to Move Upwards
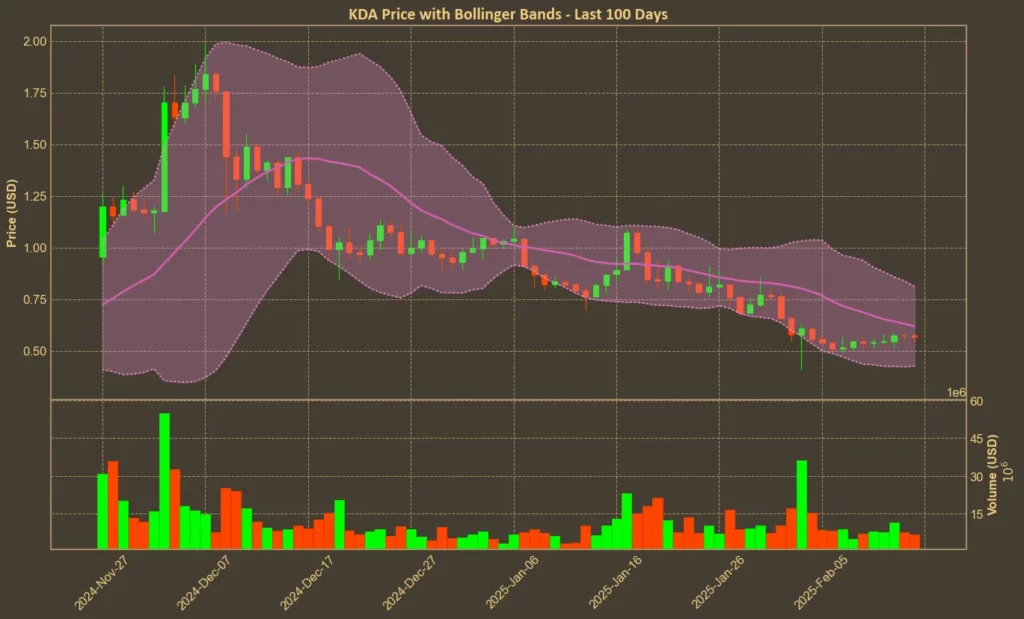
Bollinger Bands place KDA’s current price near the lower band at 0.426, indicating potential for upward movement. This position suggests that the coin may be ready to gain traction if buying pressure increases.
Trend & Volatility Indicators
ATR: Decreasing Volatility
The Average True Range (ATR) has decreased to 0.082, showing that KDA’s price movements are becoming less volatile. This reduction in volatility can lead to more predictable price actions in the near term.
AO: Improving Momentum
The Awesome Oscillator (AO) has moved to -0.1664, showing improvement from last week. This indicates that the downward momentum is easing, potentially paving the way for a price increase.
VWAP: Below Average
The VWAP today is 0.9823, showing that KDA is trading slightly above its average price when weighted by volume. This suggests that traders may be accumulating at current levels.
Relative Performance
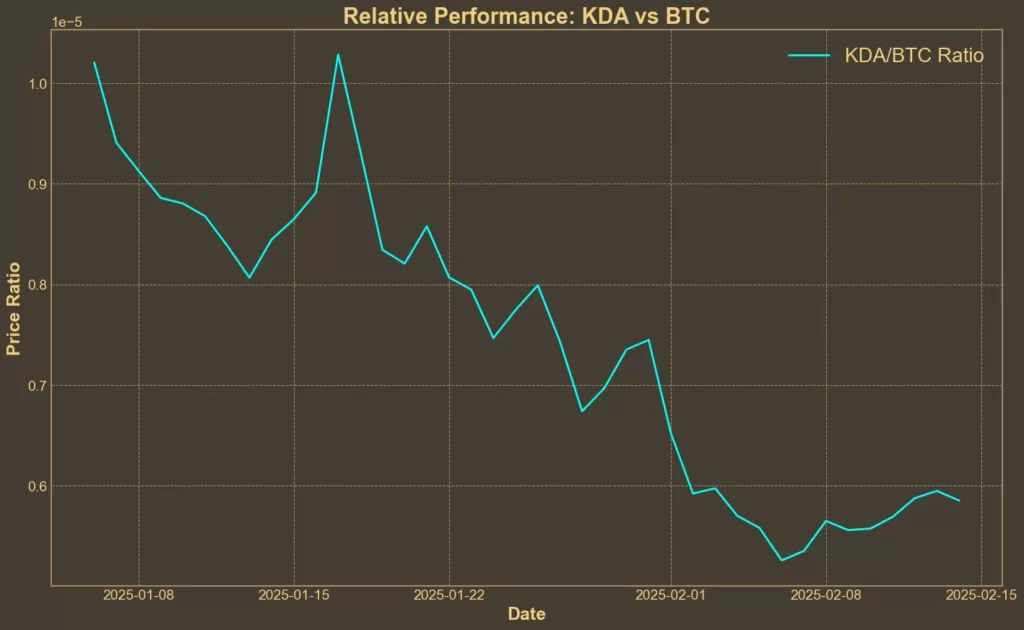
Comparison Against BTC: Short-Term Upward Trend
The KDA/BTC ratio has increased by approximately 9.6% over the past week, indicating that KDA is performing better relative to Bitcoin in the short term. However, over the last month, the ratio has declined by 34.2%, indicating that this short-term rebound follows a larger downtrend.
Conclusion: What’s Next For Kadena?
KDA’s technical indicators paint a mixed picture. While some momentum signals suggest that selling pressure is easing, the coin remains below key moving averages, indicating that the larger downtrend is still intact.
On the positive side, Kadena has shown short-term strength against Bitcoin, and indicators like the AO and MFI suggest potential stabilization. However, for a true recovery, KDA would need to break above key resistance levels and see sustained buying pressure.
The long-term outlook remains uncertain. While Kadena continues active development, its lack of mainstream attention and a weak long-term price trend don’t inspire confidence among investors.
That being said, technical analysis suggests that the downtrend is slowing and the coin is approaching oversold territory. For investors who believe Kadena can regain traction, buying at current low prices could be an opportunity worth considering.
Need a quick and easy way to see what’s happening in crypto over the next few days? Check out our Crypto Events Calendar!

