Chainlink (LINK) has seen a rough few months, with its price taking a significant hit. At its current level of $13, the coin has lost over 30% in the past month and more than 55% in the last quarter. Despite short-term fluctuations, the broader trend remains bearish, with selling pressure pushing prices lower. The market cap has also taken a hit, reflecting a cautious investor sentiment.

However, technical indicators suggest that Chainlink might be approaching oversold levels. While this doesn’t guarantee a reversal, it does highlight the possibility of short-term relief. Let’s take a closer look at the data.
Table of Contents
Momentum Indicators
RSI: Oversold
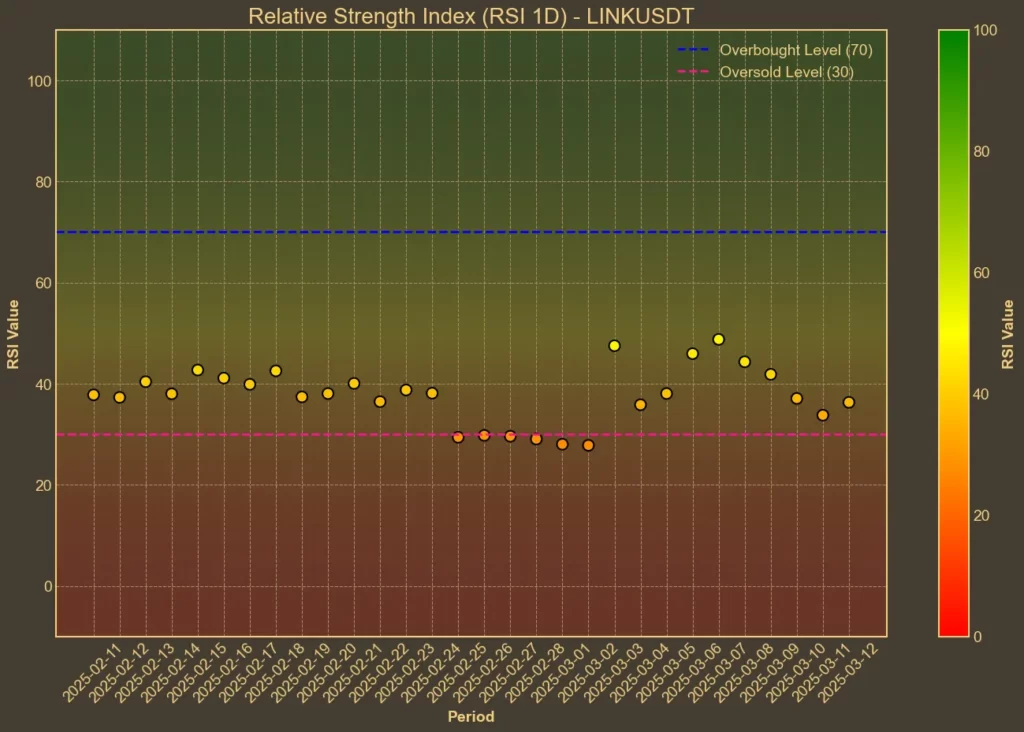
The Relative Strength Index (RSI) indicates whether an asset is overbought or oversold. With a 14-day RSI of 36, Chainlink is near the oversold zone, suggesting that selling pressure might be easing. The short-term 7-day RSI sits at 33, which reinforces this trend.

MFI: Bearish
The Money Flow Index (MFI), which factors in volume, shows continued selling pressure. With a 14-day MFI at 33, Chainlink is in bearish territory. The steady decline over the past week signals weak buying momentum.
Fear & Greed Index: Fear
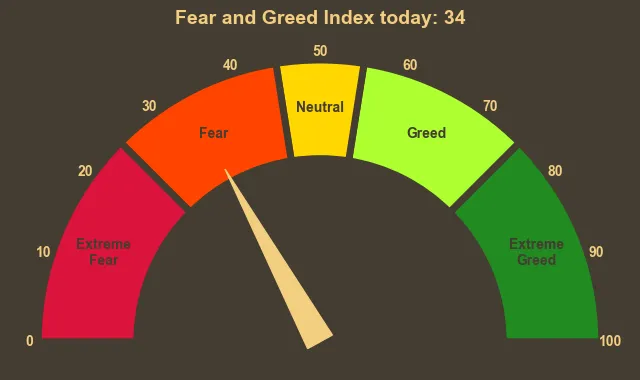
The broader crypto market sentiment is improving, with the Fear & Greed Index at 34, up from extreme fear levels seen earlier. While this shift suggests a gradual return of confidence, it hasn’t yet translated into buying pressure for LINK.

Moving Averages
SMA & EMA: Bearish
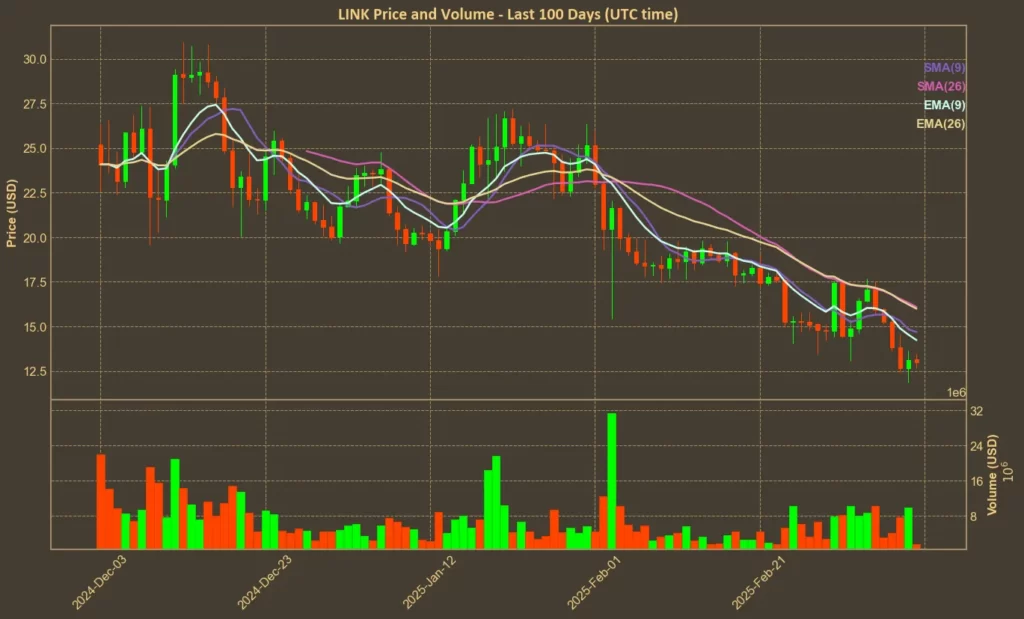
Moving averages confirm the downward trend. The 9-day Simple Moving Average (SMA) is at 14.68, while the 9-day Exponential Moving Average (EMA) is at 14.22, both well below the longer-term averages. The 26-day SMA (16.09) and EMA (15.99) reinforce the bearish outlook.

Bollinger Bands: Oversold
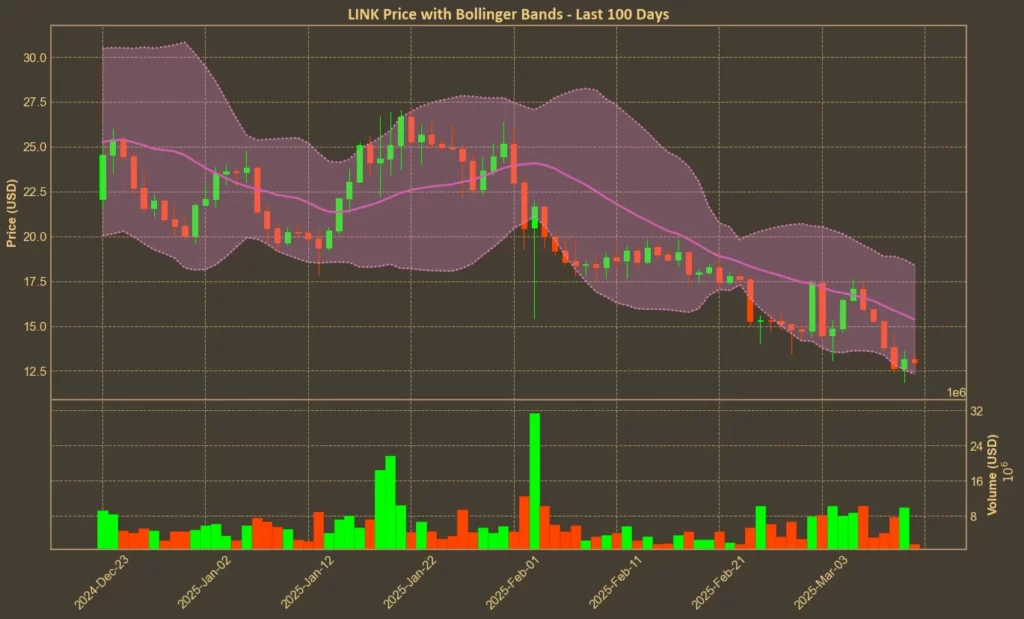
Bollinger Bands highlight volatility and potential reversal points. Currently, LINK’s price is near the lower band at 12.33, which suggests that it might be oversold. If buying pressure increases, a short-term rebound could be on the horizon.

Trend & Volatility Indicators
ADX: Moderate Trend Strength
The Average Directional Index (ADX) measures trend strength. LINK’s ADX of 34 indicates a moderate trend, meaning the bearish movement is still intact but could weaken if selling slows down.
ATR: High Volatility
The Average True Range (ATR) is at 1.69, slightly down from last week. While this suggests that volatility is still present and high, it has begun to stabilize, which could lead to more predictable price action.
AO: Bearish
The Awesome Oscillator (AO) is currently at -2.87, showing negative momentum. Despite this, the value is only slightly worse than a week ago, suggesting that selling pressure is not accelerating further.
VWAP: Below Average
The Volume Weighted Average Price (VWAP) sits at 22.03, which is far above the current price. This confirms that LINK is trading below its fair value when factoring in volume.
Chainlink at the Crypto Summit
Beyond technical indicators, Chainlink is at the center of major developments. The Trump administration’s crypto summit recently featured Chainlink’s co-founder, Sergey Nazarov, alongside other industry leaders. While this growing political and institutional interest could be a long-term catalyst, it has yet to lead to tangible market impact.
What’s Next for LINK?
The technical picture for Chainlink remains bearish, but there are early signs that the sell-off could be slowing. RSI and Bollinger Bands suggest oversold conditions, while the ADX points to a weakening trend. However, the lack of strong buying pressure and the continued movement of LINK to exchanges indicate that recovery is not yet in sight.
For traders, a short-term bounce could be possible if buyers step in at current levels. However, a sustained reversal will require stronger market sentiment and renewed demand. As always, technical analysis has its limitations – it doesn’t account for unexpected news or fundamental shifts in the market.
Are you investing in crypto presales? We’ve launched Presale Index – your go-to resource for checking if a project is legit before you invest. Don’t get caught in a scam – look it up in our index first!


