Livepeer (LPT), a prominent decentralized video streaming protocol, has shown notable movements in recent months. By delving into its technical indicators and price trends, we can gain insights into its current market positioning and potential future performance.
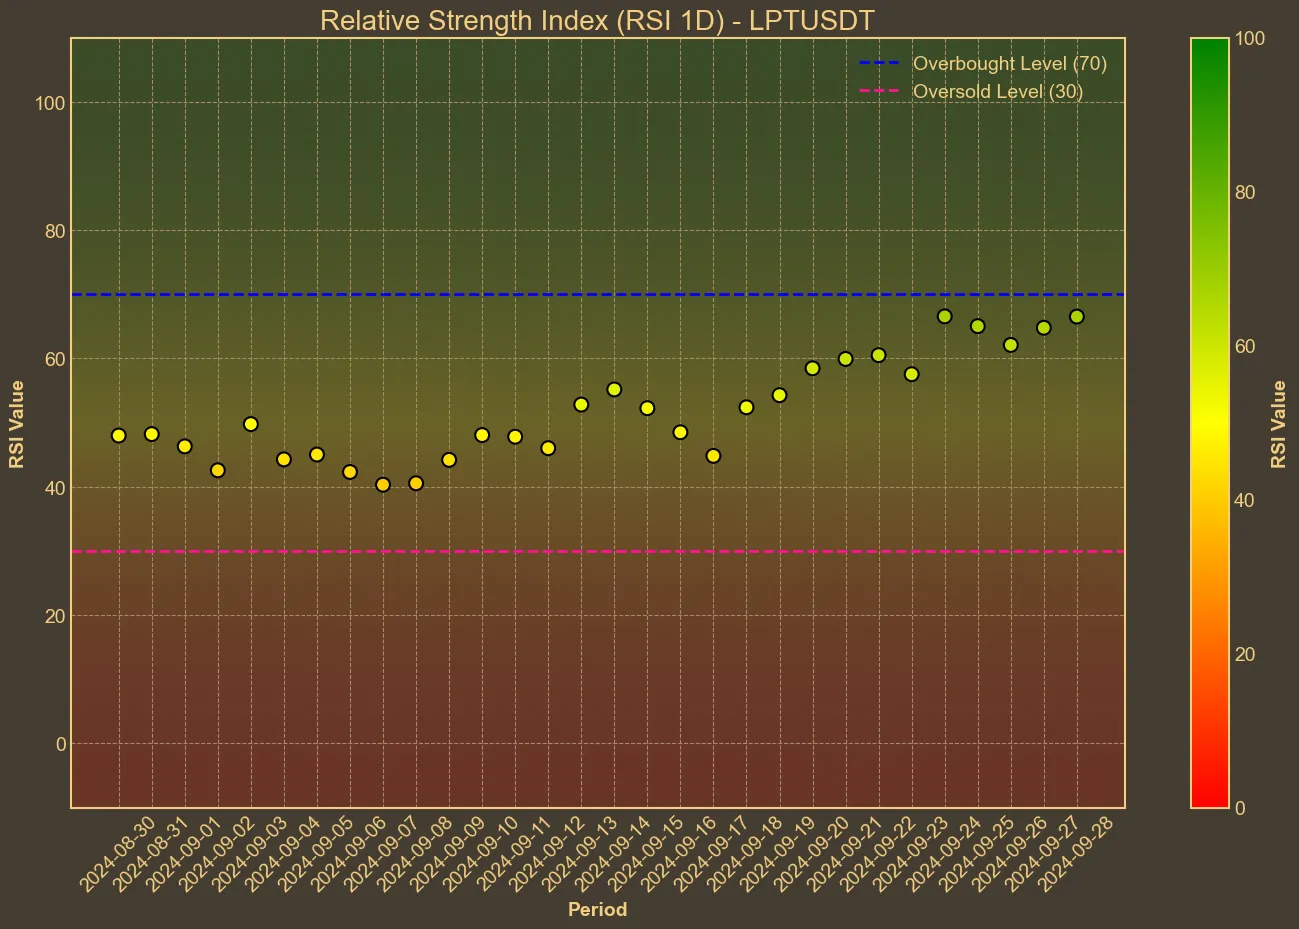
To start with, Livepeer has experienced a considerable price rise, showing an increase of 16% over the past month and a striking 171% over the last year. However, the recent quarter saw a slight decline of 6.5%. This varied performance signals periods of both consolidation and bullish momentum. Additionally, the Relative Strength Index (RSI) staying around the 60s, specifically today at 62, suggests that the token currently lies in a stable zone but is approaching overbought territory. This can often attract new buyers while giving existing holders an optimistic outlook.

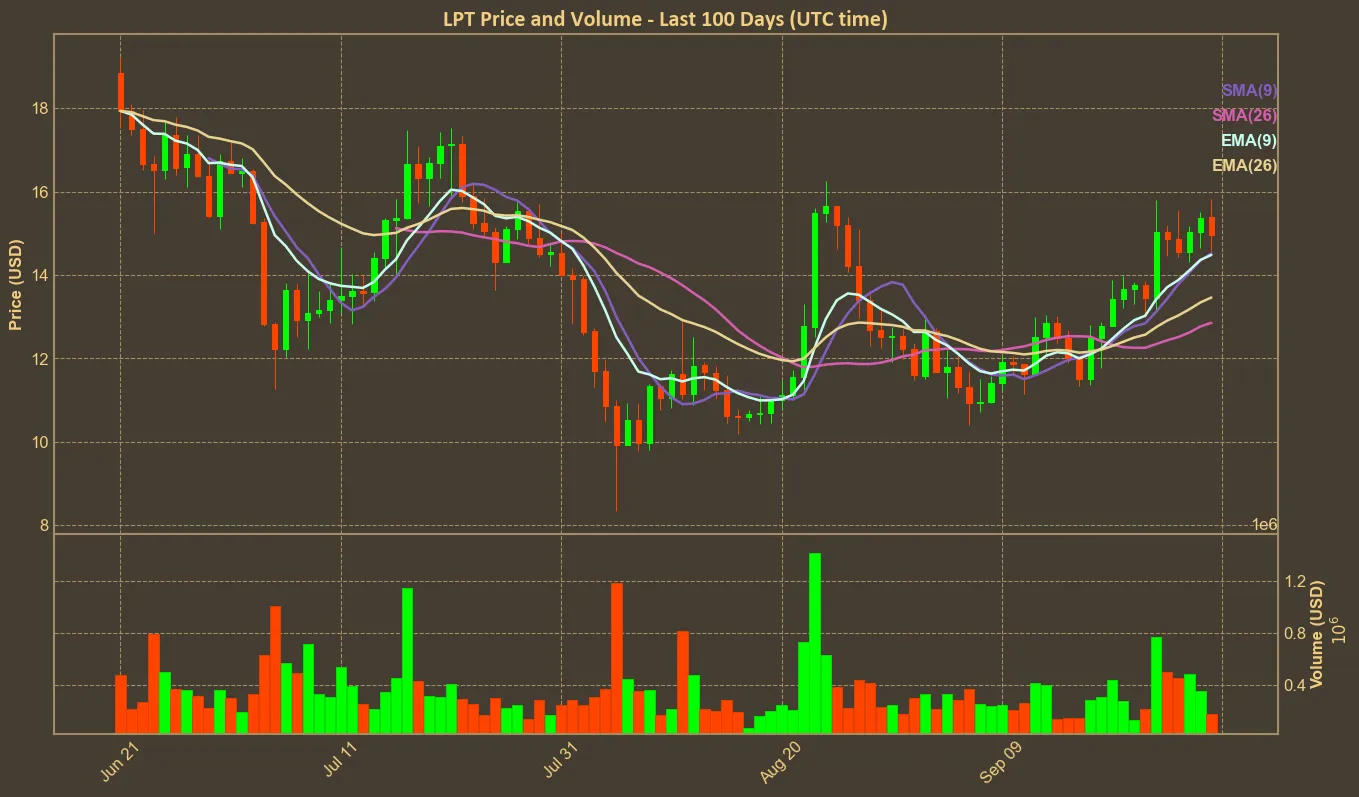
The Moving Averages provide further evidence of upward momentum. The Simple Moving Average (SMA) has been steadily increasing from 12.25 seven days ago to 12.85 today. Similarly, the Exponential Moving Average (EMA) has also shown a consistent rise over the last week. This sustained increase in both SMA and EMA suggests that Livepeer has been gaining strength over a longer period, consolidating its position without severe downturns.

Another positive sign is the Bollinger Bands (BB) analysis. With the upper band (BB_H) at 15.81 and the lower band (BB_L) at 10.8, the price of LPT is leaning towards the higher end. This indicates a higher volatility period where the price is more likely to spike upwards than downwards. However, this is a double-edged sword as investors need to keep an eye on potential retracements.
Transaction volume also plays a crucial role in the market analysis. Despite the volume dropping 19.41% in the last seven days, it saw a significant increase of 40.35% over the past 30 days. This fluctuation could imply that recent investors are either consolidating their positions or waiting for the next breakout before re-entering the market.
Market Cap trends over the past month paint an optimistic picture as well, despite minor drops in the short term. The Market Cap experienced a significant rise of 15.99%, aligning with the overall positive sentiment surrounding Livepeer. A downward trend in Market Cap Change over the last few days might simply reflect a short-term correction period.
Livepeer is currently in a positive trend with some potential for further growth. However, it is essential to consider that technical analysis has its limitations. Sudden external factors, market sentiment changes, and broader economic conditions can disrupt even the best-analyzed trends. Therefore, while Livepeer’s technical indicators suggest promise, investors should always be cautious, evaluating both internal data and external factors before making any decisions.


