Litecoin is still holding onto a spot in the top 25 coins, but price action over the past few weeks has shown more weakness than strength. At the time of writing, LTC is trading at $87 – a minor bounce from recent lows, but still down over 25% in the last three months.
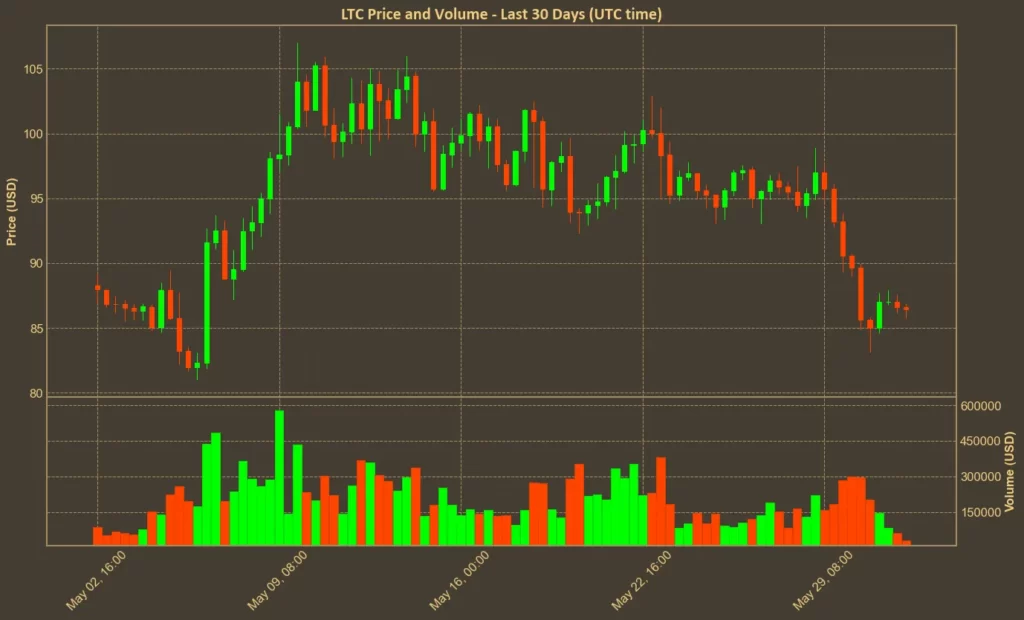
Volume is shrinking, the LTC/BTC ratio is falling, and most moving averages are pointing south. But despite the pressure, not all indicators are bearish. Some are hinting at a possible short-term reversal – or at least a pause in the current downtrend.
Table of Contents
Click to Expand
Momentum Indicators
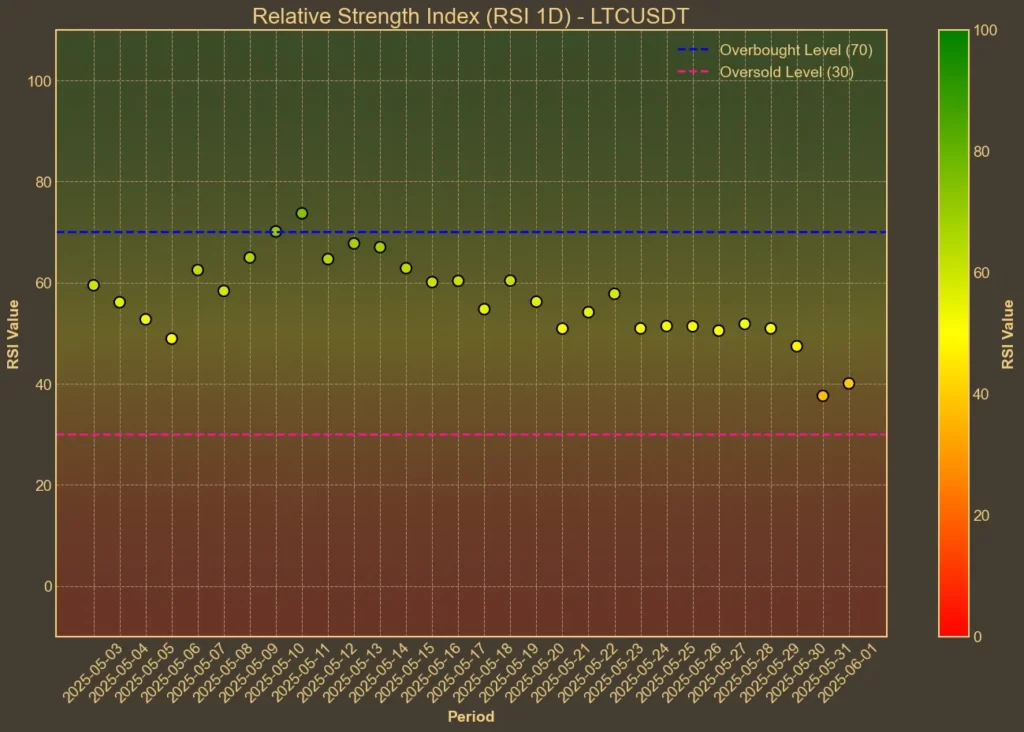
RSI: Close to Oversold
The Relative Strength Index is getting closer to the oversold zone. The long-term RSI(14) dropped to 39, continuing its slow decline from 51 just a week ago. The short-term RSI(7) now sits at 28 – already in the oversold territory. While this doesn’t guarantee a bounce, it does show the exhaustion of sellers.
MFI: Close to Oversold
The Money Flow Index also paints a picture of fading buying pressure. MFI(14) has dropped to 32, with steady declines over the last week. Falling volume alongside falling price suggests that interest in LTC is cooling – not just from retail, but also from larger players.
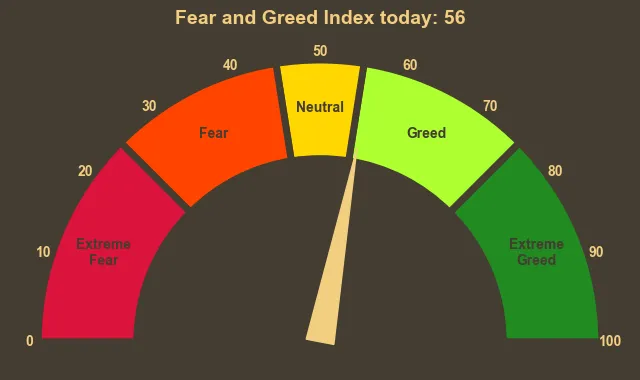
Fear & Greed Index: Neutral
The broader crypto market has shifted from greed to neutrality in the past few days. From highs in the 70s last week, the index dropped sharply to 56 today. That reflects a wider pullback in sentiment – not necessarily a Litecoin-specific signal, but relevant when evaluating how far LTC could fall if the broader market continues to soften.
Moving Averages
SMA & EMA: Bearish
LTC is now trading well below both its short and mid-term moving averages. The current price is under the EMA(9) and SMA(9), which sit above $91. The 26-day averages are even higher – SMA(26) at $96.5 and EMA(26) at $93.1. That confirms a bearish structure and signals that any upside moves will face strong resistance.

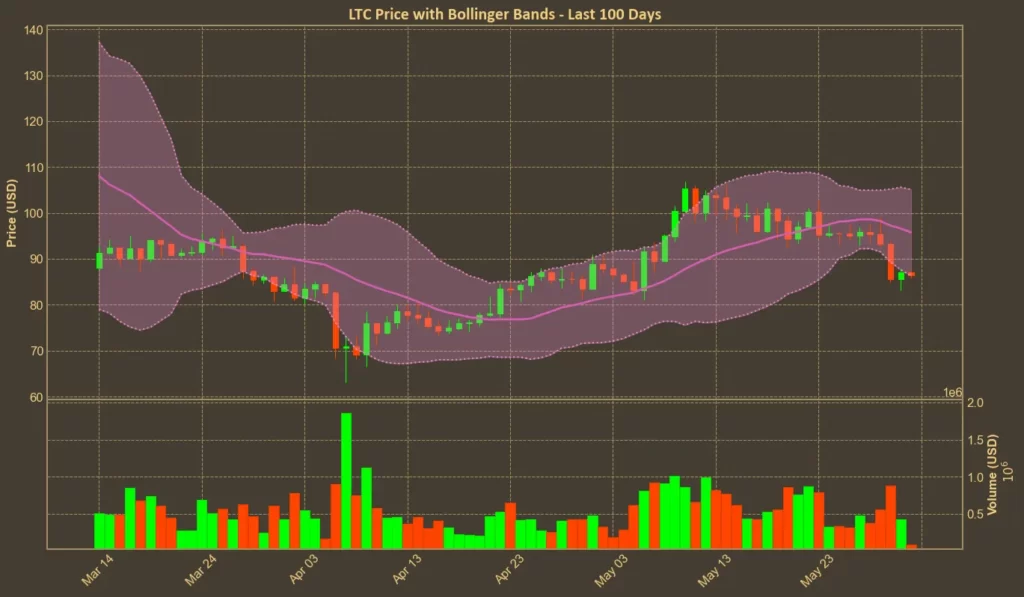
Bollinger Bands: Oversold
Litecoin is now close to the lower Bollinger Band, currently at $86.4. With the price just slightly above that mark, it suggests that LTC is near short-term technical support. A bounce from here wouldn’t be surprising, but unless it breaks above the mid-band, it’s just a short-term relief – not a trend reversal.
Trend & Volatility Indicators
ADX: No Clear Trend
The Average Directional Index is sitting at 17 – a level that typically indicates the absence of a strong trend.
ATR: Low Volatility
The Average True Range has been declining, with ATR(14) falling to 5.22. That suggests lower volatility – but in combination with shrinking volume, it likely means there’s not much conviction behind recent moves in either direction.
AO: Bearish
The Awesome Oscillator has flipped to negative and is dropping quickly. From 4.26 last week to -3.6 today, this signals strong bearish momentum and supports the case that the recent bounce may not last.
VWAP: Bearish
With VWAP at 98.1 and price hovering over $86, Litecoin remains far below its volume-weighted average. This shows it is trading at a discount to recent averages – but it also signals that buyers haven’t stepped in yet to lift it back toward trend.
Relative Performance
Comparison Against BTC: Underperforming
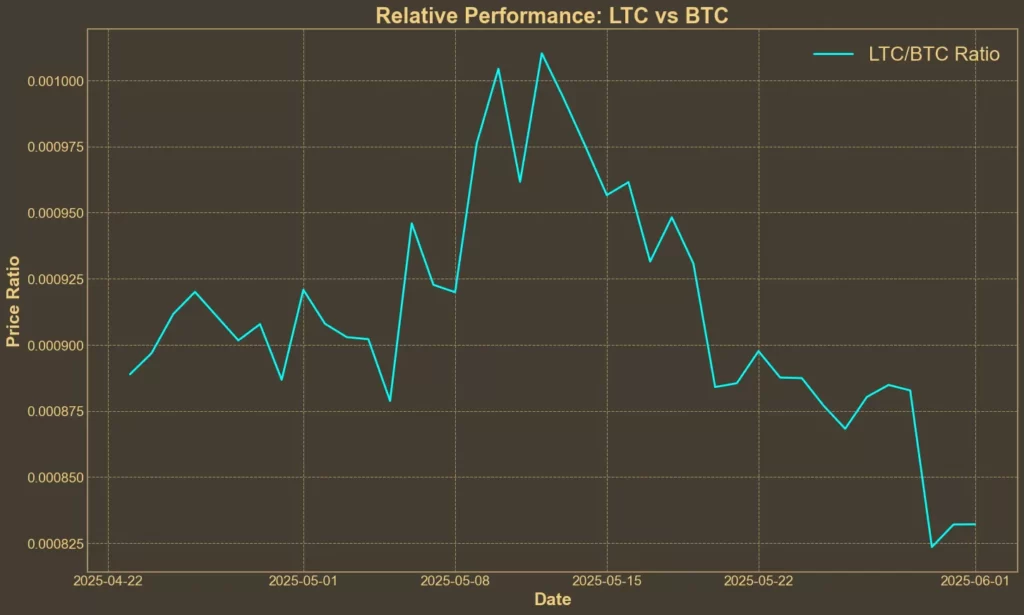
The LTC/BTC ratio has been falling steadily, now down over 5% in the past week and nearly 8% in the last month. Litecoin is underperforming Bitcoin in both short and mid-term timeframes, and the chart shows no sign of that reversing.
Final Thoughts
While Litecoin has clear technical weaknesses right now – particularly on trend and volume metrics – the momentum indicators are close to levels that often trigger relief bounces. Oversold short-term RSI, proximity to the lower Bollinger Band, and weak ADX could lead to short-term upside. But any gains are likely to run into resistance unless LTC regains key moving averages.
Outside of the charts, Litecoin continues to make progress on the development front. On May 29–30, the Litecoin Summit 2025 took place in Las Vegas, Nevada, gathering developers and businesses to discuss upgrades, adoption efforts, and future use cases. The announcements haven’t moved the charts yet, but they could feed into sentiment later on.
As always, technical analysis doesn’t capture long-term adoption trends or shifts in regulatory tone. It reflects the current picture – and right now, that picture shows weakness with a chance of short-term stabilization.
Read also: ETF Delays Are Piling Up – But Investors Aren’t Worried Yet


