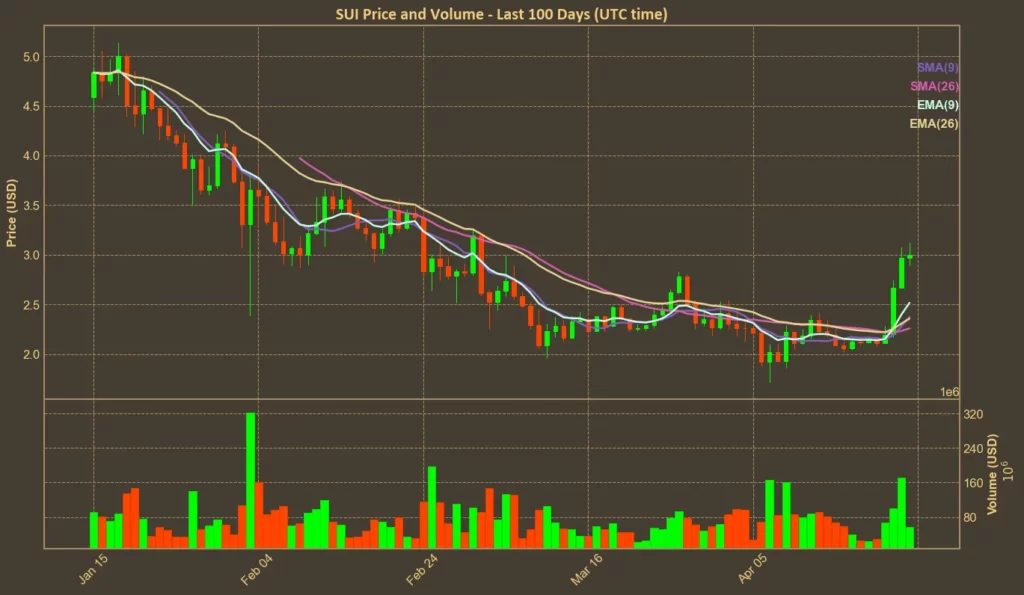
After weeks of flat movement, Sui has staged a sharp rebound. Its price climbed over 43% in the last seven days, with volumes exploding more than 260% over the past month. The move puts Sui back above $3, boosting its market cap to nearly $10 billion. The market is clearly interested again – partly thanks to the DeepBook Protocol hype – but is this the start of a longer run, or just a temporary breakout?
Table of Contents
Click to Expand
Momentum Indicators
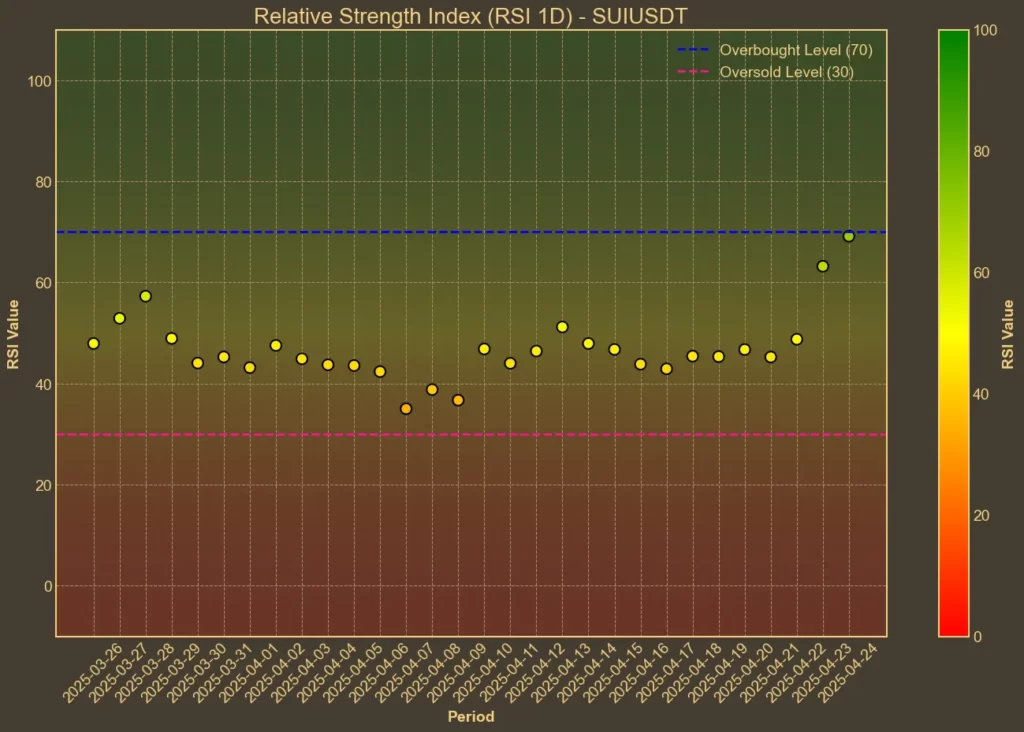
RSI: Overbought
The RSI shows how fast prices are changing, and whether a coin might be due for a pullback. Right now, RSI(14) is at 70 – a level that suggests the coin is overbought. Short-term RSI(7) is even more extreme, hitting 85.
This usually means there’s strong buying pressure, but it can also signal that a correction might follow if that pressure fades.

MFI: Overbought
MFI is similar to RSI, but includes volume, making it harder to fake. It also sits near the overbought zone, with MFI(14) at 69. That tells us the money is flowing in fast – but again, might be running hot.
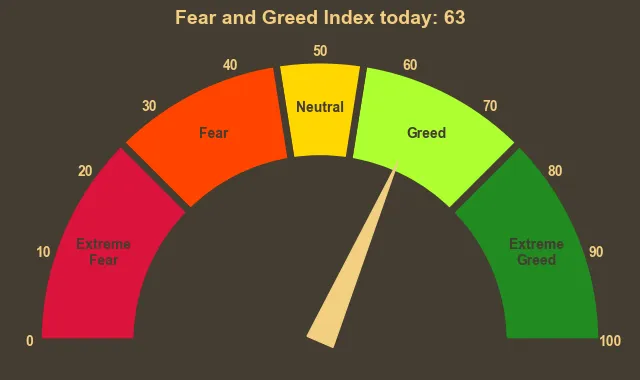
Fear & Greed Index: Greed
This isn’t specific to Sui but helps set the context. The broader crypto market has shifted rapidly from fear to greed in the past week, climbing from a low of 30 to 63. Sentiment is optimistic, but big mood swings like this often lead to emotional trading.

Read also: How To Use Crypto Fear and Greed Index To Your Advantage?
Moving Averages
SMA & EMA: Bullish
Short-term and mid-term moving averages confirm the uptrend. With both SMA(9) and EMA(9) well above the longer-term SMA(26) and EMA(26), Sui is now trading with clear momentum. These levels support a bullish outlook – as long as the price doesn’t reverse too fast.

Bollinger Bands: Overbought
The current price sits near the upper Bollinger Band at $2.82. When this happens, the asset is typically considered overbought, or at risk of retracing. At the same time, the wide gap between bands shows higher volatility. Traders should expect big swings – in either direction.

Trend & Volatility Indicators
ADX: Weak Trend
The ADX is only at 20 – not a strong trend signal. Even with the recent spike, this suggests the rally might not be fully backed by long-term conviction yet. That can change fast, but for now it’s a yellow flag.
ATR: High Volatility
The Average True Range has jumped, confirming the recent price swings are not a fluke. This supports what the Bollinger Bands are showing – volatility is back.
AO: Bullish
The Awesome Oscillator flipped positive, rising from -0.1 to 0.23 in a week. This means momentum has shifted to the upside. It also adds confirmation that this rally is stronger than just a single spike.
VWAP: Neutral
Sui is trading right on top of its VWAP at $3.00. That’s a balanced signal – it shows that traders are paying a fair price relative to recent volume, but it doesn’t point strongly in either direction.
Relative Performance
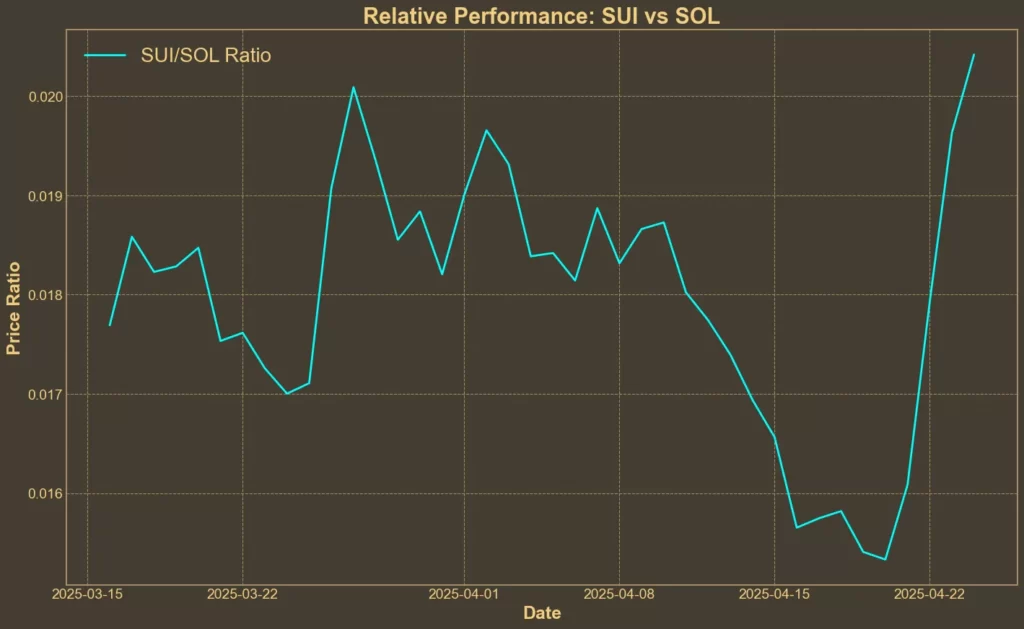
Comparison Against SOL: Bullish
The SUI/SOL ratio has surged nearly 30% in the past week. That’s a clear sign that Sui is outperforming, not just gaining in isolation. The strength of this move suggests real capital rotation is happening, with money flowing into Sui instead of just riding a general crypto rally.

Final Thoughts
Technical indicators lean bullish right now, with strong momentum, increasing volume, and favorable relative performance. But the rally is also running hot. RSI and MFI are both in overbought territory, and volatility is spiking. That could mean a short-term pullback is coming – or at least a pause before the next move.
Read also: AI Crypto Coins Are Surging – Here are Top 4 to Watch


