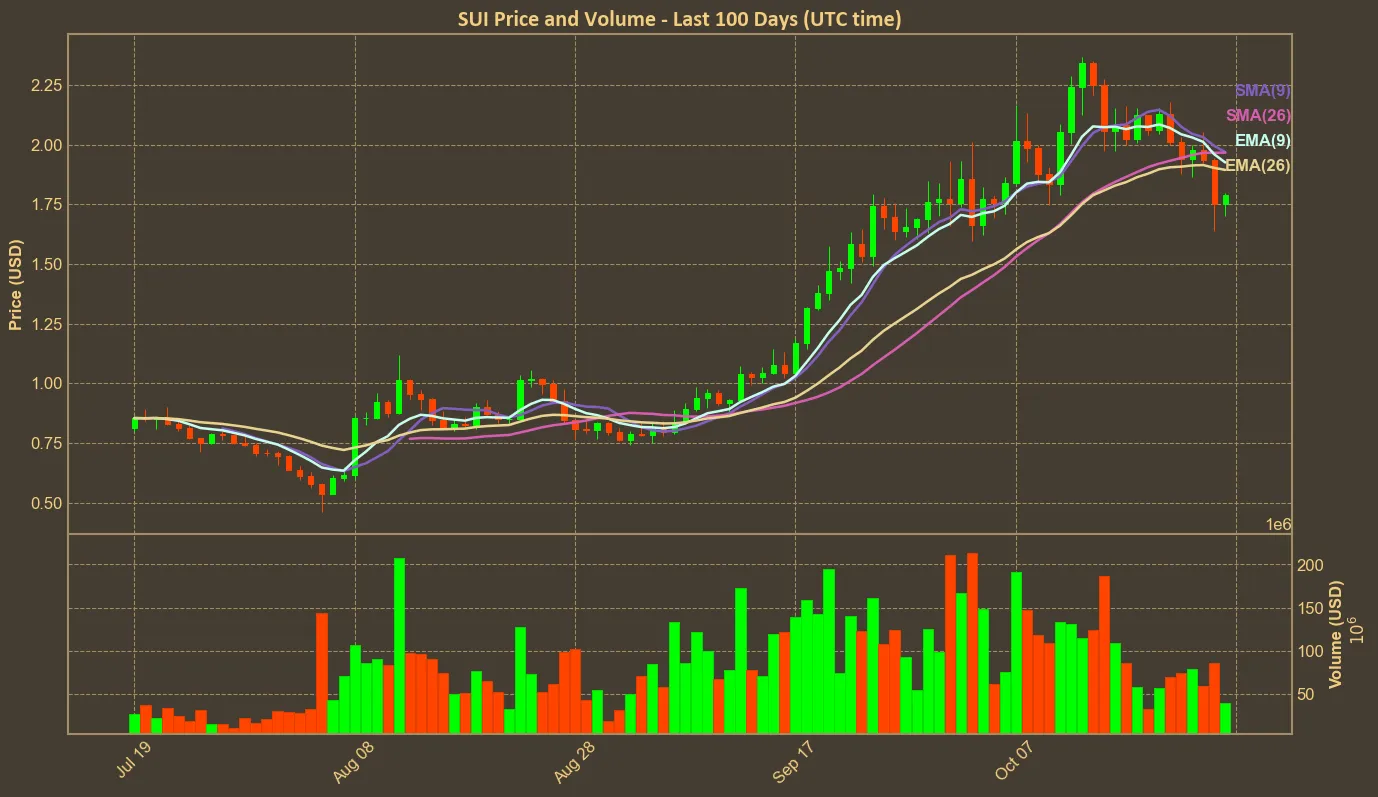
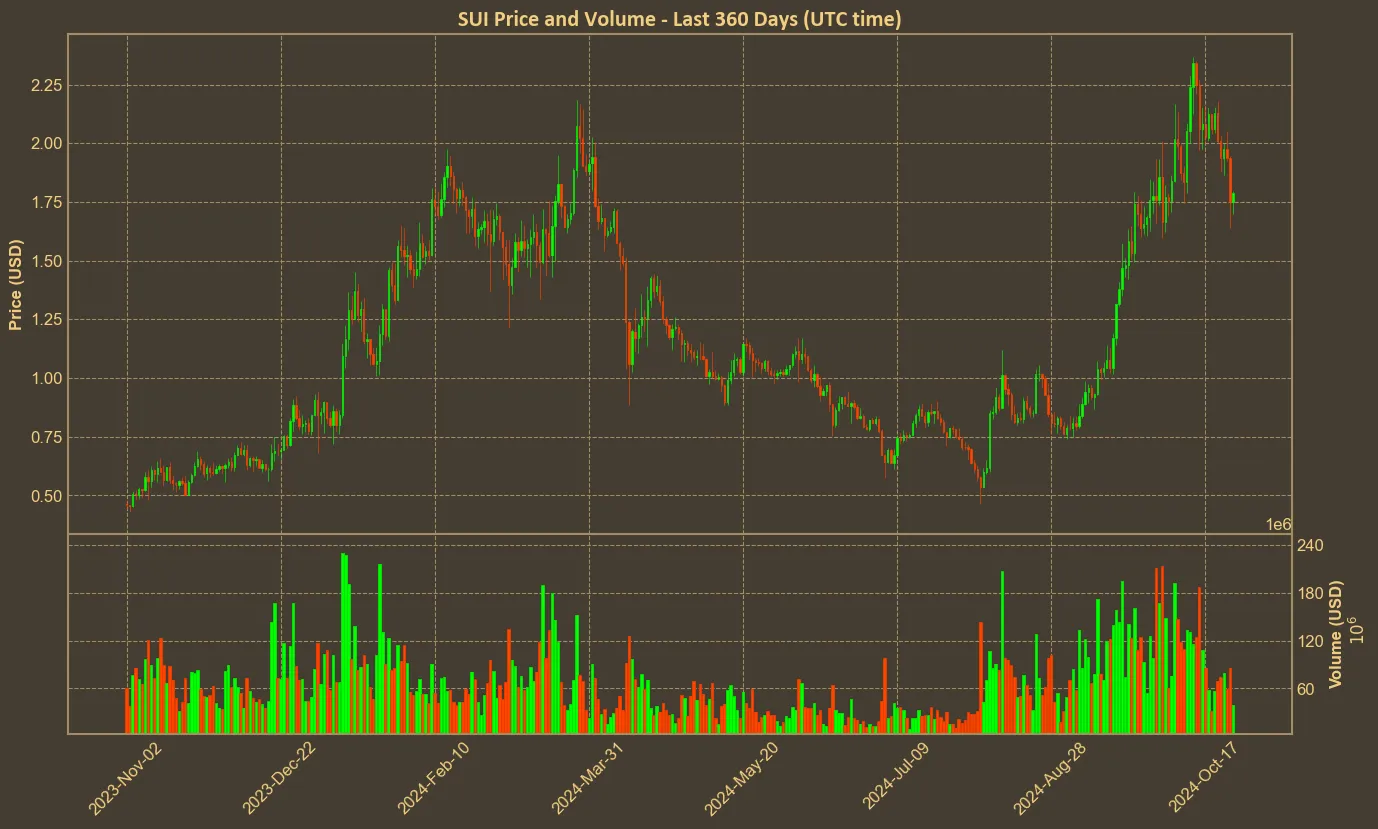
Sui’s recent market behavior has left analysts and traders contemplating its future trajectory. Despite a notable surge over the last two months and setting new ATH at $2.36, recent weeks have painted a more complex picture with price dropping below $1.80. Sui’s price has shown fluctuations, with a recent downward shift overshadowing its previous monthly gains. Though the long-term growth remains impressive, short-term indicators suggest a pause in its rapid ascent.
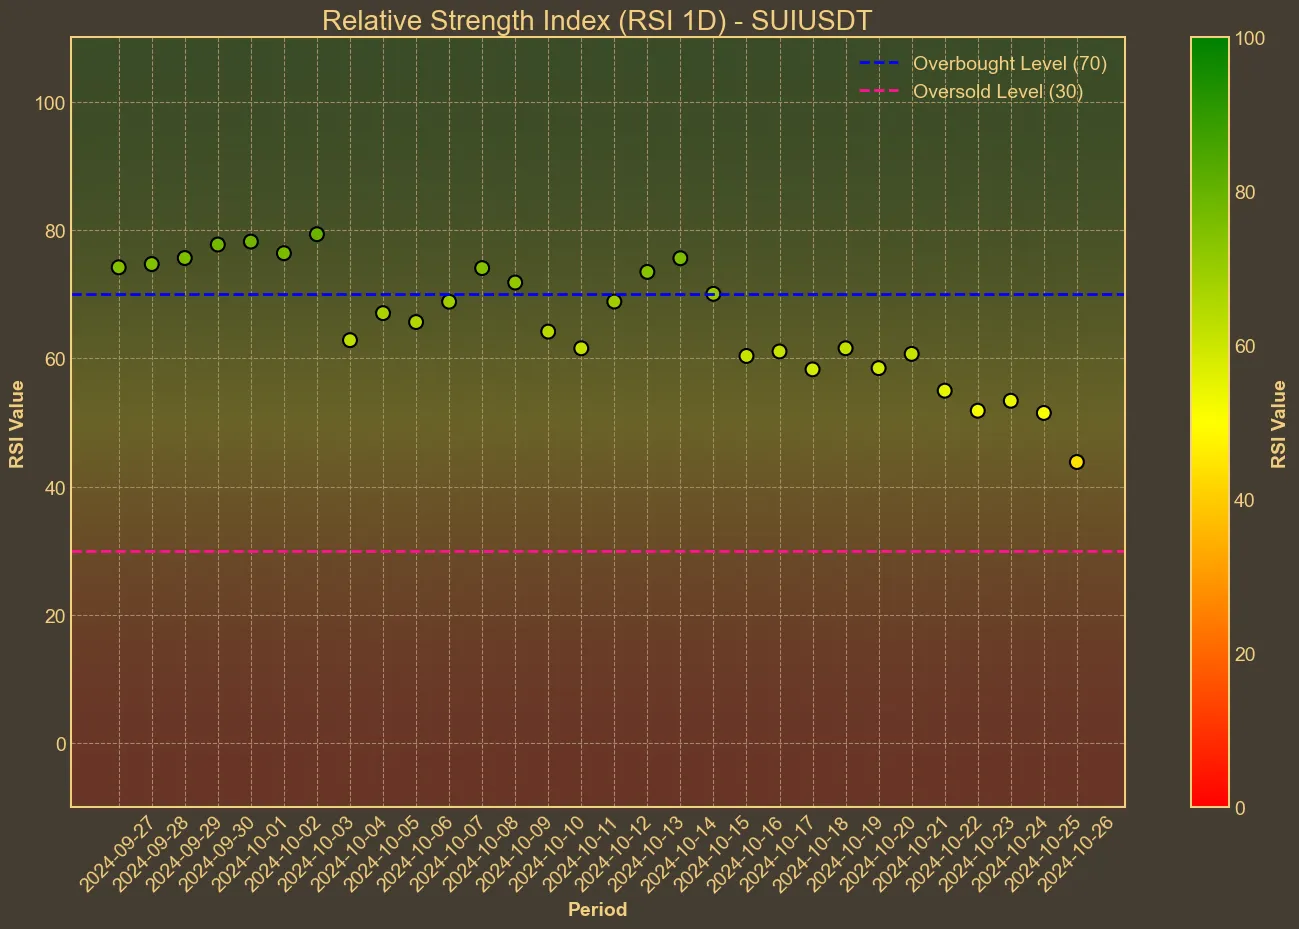
Examining some of the technical indicators gives more clarity on Sui’s momentum. The Relative Strength Index (RSI) points to a neutral sentiment, moving below the crucial midline over the past few days. This shift hints that buying enthusiasm may be waning, yet it’s not fully transitioning into bearish territory.
 When looking at the Moving Averages, Sui recently dropped under its 20-day EMA for the first time in several months, a movement that often signals caution among traders. Such developments tend to cause market participants to reassess and recalibrate their strategies toward this cryptocurrency.

Meanwhile, shifts in market dynamics also hint at broader implications. A reduction in trading volume alongside a declining market cap echoes an overall hesitancy among traders. This caution, captured by a subdued Long/Short Ratio, suggests that many may be adopting a wait-and-see approach.
Despite these hesitant signals, there’s always the possibility of a market turnaround. An uptick in volume could signal renewed confidence, potentially fostering a price rebound. We must also remember the circumstances we’re in – in the last few weeks SUI had a meteoric rise, setting new all-time highs more than once. We predicted that at some point a pullback might happen.
While the current technical indicators lean towards a potential dip for Sui, one must consider the speculative nature of this market. Technical analysis, while insightful, operates under the influence of numerous unpredictable external factors. The broader market sentiment, news events, hype with new price highs and technological developments can all rapidly alter expected outcomes. SUI is also tied to bigger cryptocurrencies performance – such as Bitcoin, which is down almost 1.5% today.


