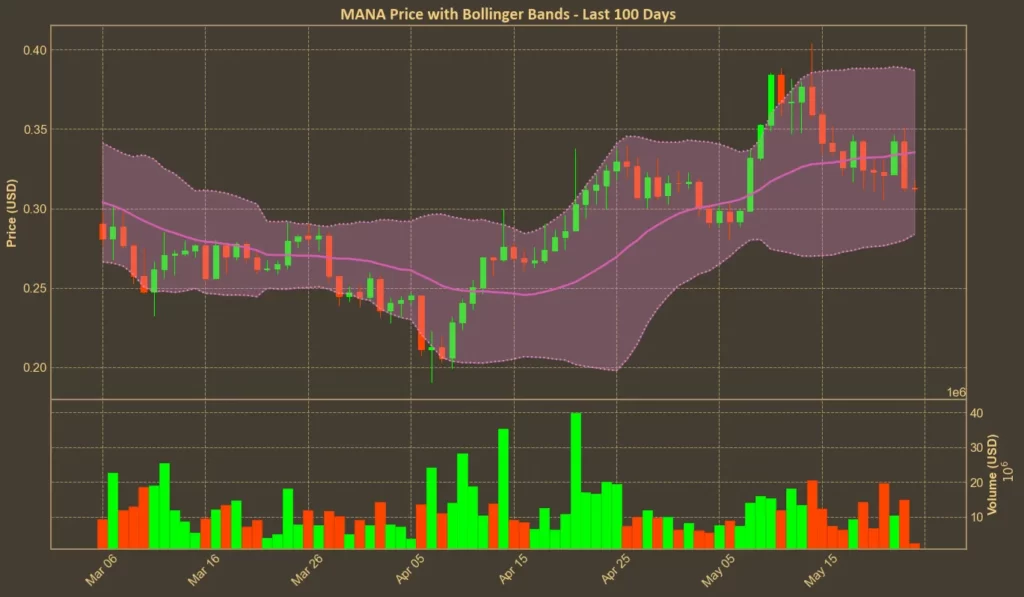
Decentraland (MANA) has shown mixed signals following a modest recovery in early May. Now trading around $0.31, the coin is back under pressure, falling over 8% in the past 24 hours. While still far below last year’s levels, attention is turning to whether MANA can gather enough momentum to retest the $0.4 mark – a barrier it briefly touched on May 14.
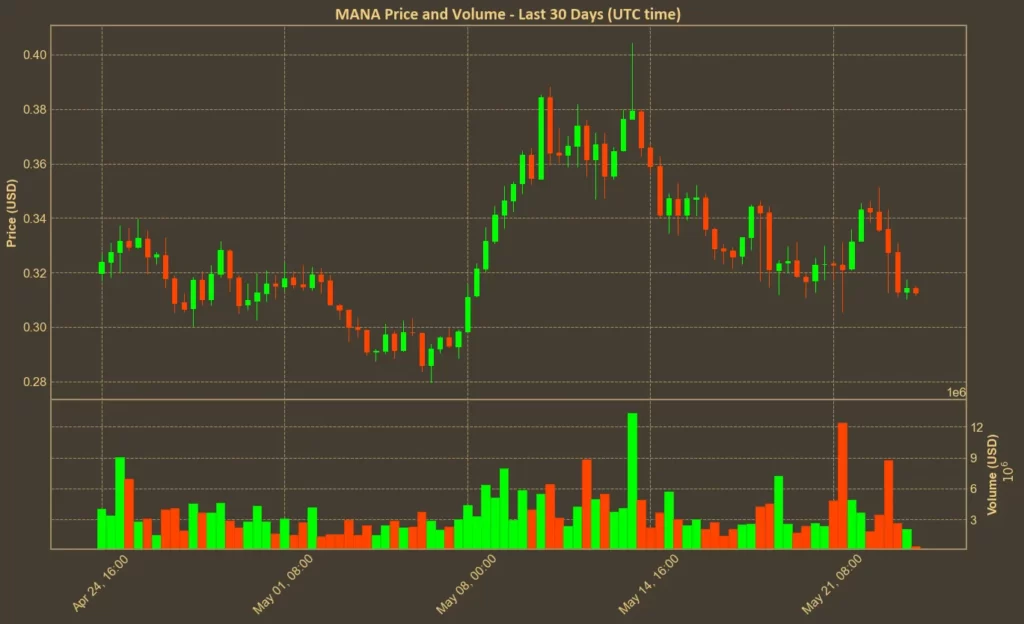
Despite short-term volatility, some are hoping for a breakout. But recent trends suggest hesitation, and the technical indicators offer a more cautious picture.
Table of Contents
Click to Expand
Momentum Indicators
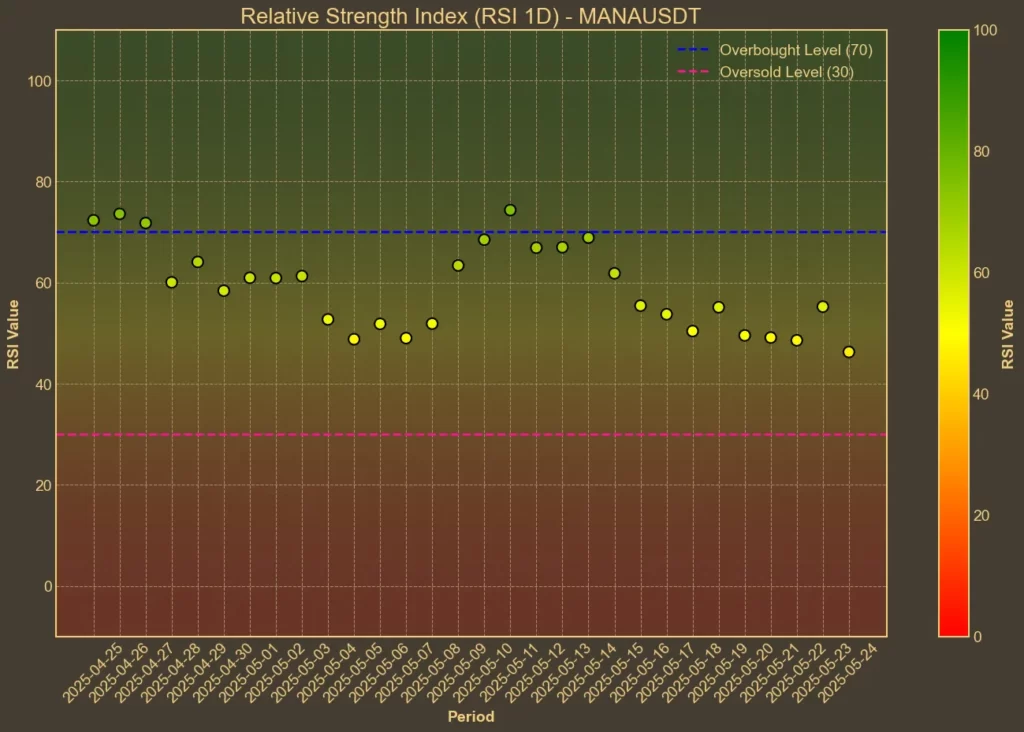
RSI: Neutral
The RSI, which signals whether the coin is overbought or oversold, sits at 46. That’s neither too high nor too low. Short-term RSI is slightly weaker at 39, hinting at more selling than buying recently, but nothing extreme.
MFI: Oversold
The Money Flow Index has dropped sharply to 33 from 58 a week ago. This points to a reduction in capital entering the coin and could indicate growing sell pressure.
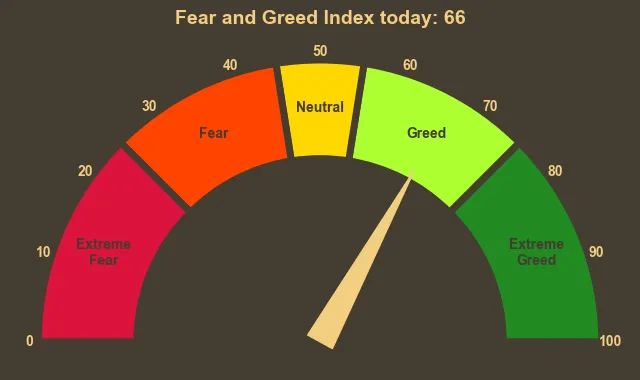
Fear & Greed Index: Greed
The market as a whole is still tilted towards greed, but the recent drop from 78 to 66 suggests that sentiment is cooling off. This may impact MANA indirectly, especially if traders become more risk-averse.
Moving Averages
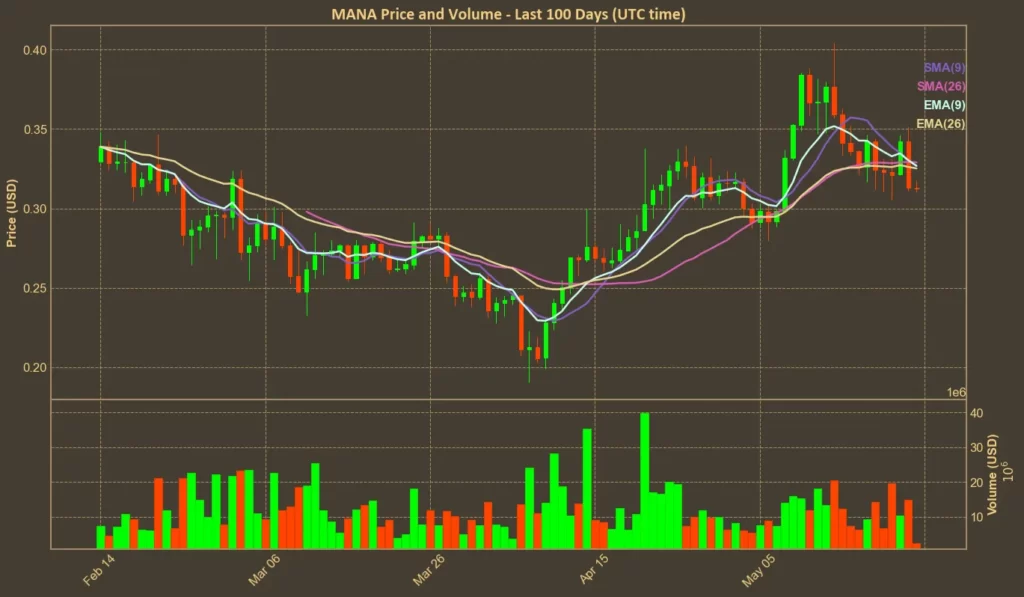
SMA & EMA: Bearish
Both short-term and longer-term moving averages are above the current price. This usually points to a bearish trend, as price struggles to climb above its average levels.
Bollinger Bands: Increased Volatility
With the current price hovering closer to the lower band, it suggests that MANA may be entering oversold territory. This setup often leads to a short-term bounce, but it’s not guaranteed.
Trend & Volatility Indicators
ADX: Weakening Trend
The ADX has declined from 32 to 26, which means the strength of the current trend – downward – is fading. This could mean consolidation or a potential reversal.
ATR: Low Volatility
ATR, which measures volatility, has slightly decreased. This may point to reduced short-term price swings, but a breakout in either direction could still come soon.
AO: Bearish
The Awesome Oscillator has flipped negative, showing that recent price movements have lost upward momentum.
VWAP: Below Average
Price is below the volume-weighted average price, which means the current value is lagging behind where most recent trading has occurred. That’s generally a bearish sign.
Summary
Most technical signals are leaning toward weakness or neutrality. Momentum is fading, volume is dropping, and the price remains below key moving averages. While some short-term indicators hint that MANA might be oversold, there’s little evidence of strong buying pressure building up.
For now, a move toward $0.4 looks unlikely without a significant change in sentiment or trading volume. However, technical analysis reflects only current trader behavior – it doesn’t predict future catalysts. If new developments appear, the picture could shift quickly.
Read also: Why Not Staking Your Solana Might Be Costing You Money


