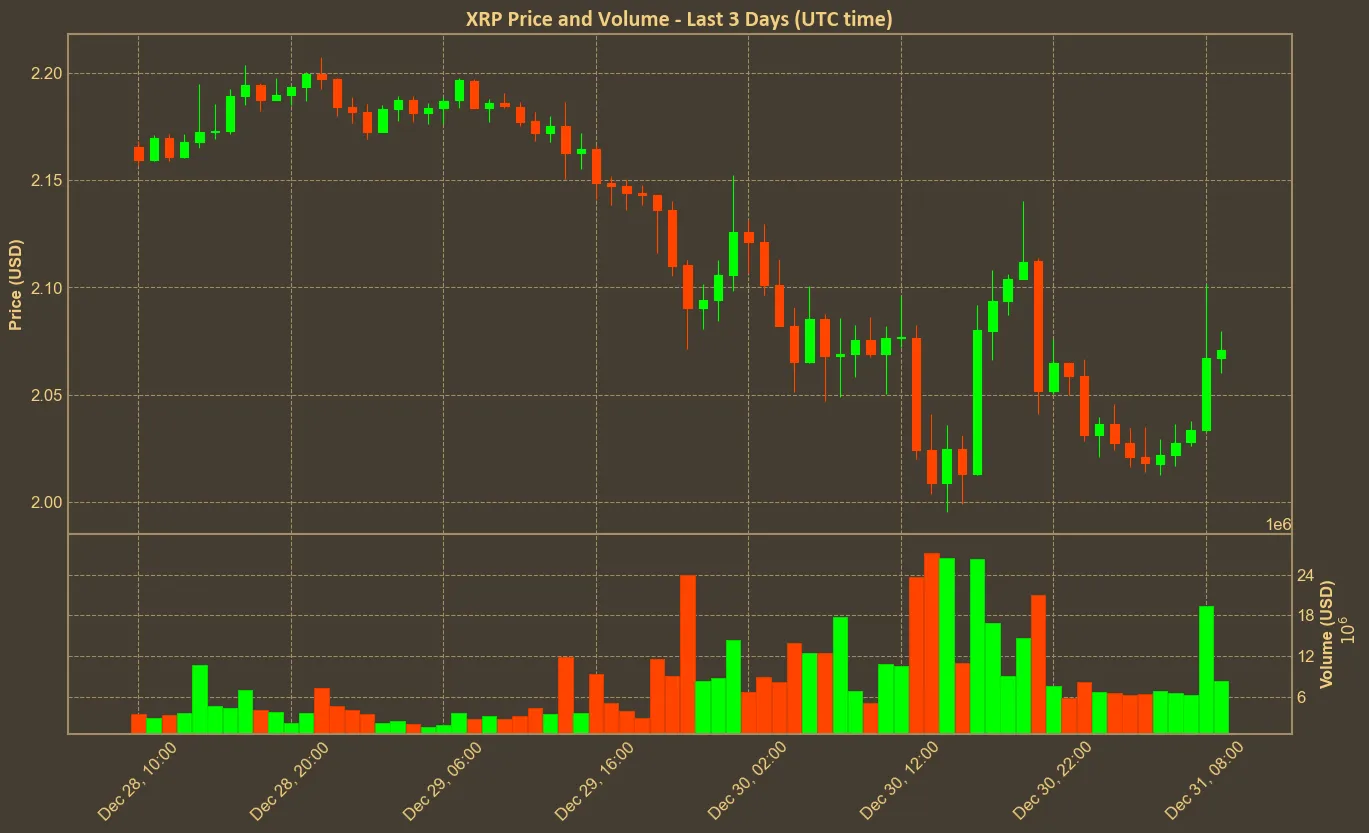
Ripple’s XRP is currently holding the fourth spot by market capitalization with a value of $2.06. This is a big growth over the past year, surge by over 230%. However, the recent trends indicate a shift – last month was mostly bearish after the price skyrocketed in November. So far Ripple was able to hold the $2 resistance on sudden dips – but now the price slowly approaches this level without volatility, sparking uncertainty among investors.

Table of Contents
Current Trends
In the last month, XRP has experienced a decline from levels above $2.70 to current $2.06, with a market cap of $118 billion. Despite this short-term downtrend, the coin remains significantly higher than its position near $0.50 before November. This resilience highlights XRP’s strong foundation, yet the current consolidation phase suggests uncertainty among traders.

XRP is currently consolidating within a symmetrical triangle pattern, trading close to the lower trendline at around $2.04. Historically, this level has served as a strong support zone, often prompting rebounds. If XRP can maintain above this mark, it may test the upper resistance around $2.48. A successful breakout above this point could signal further upward movement, potentially steering XRP towards $3 or beyond.
Volume and Momentum
Analyzing volume trends reveals a mixed picture. While daily trading volume has decreased by 37% over the past month, there was a significant spike of 159% in the last seven days. This recent increase in volume could indicate renewed interest, possibly supporting a price increase if buying pressure continues.
The Relative Strength Index (RSI) stands at 46, suggesting that XRP is neither overbought nor oversold. This neutral position hints at a balanced market sentiment, allowing room for both upward and downward movements.

Additionally, moving averages show stability with the Simple Moving Average (SMA) holding steady around $2.31 and the Exponential Moving Average (EMA) slightly declining to $2.15. These indicators reflect a cautious market awaiting the next significant price movement.

Impact of RLUSD and Market Sentiment
Ripple’s introduction of the RLUSD stablecoin adds another layer to XRP’s technical landscape. RLUSD is backed 1:1 by U.S. dollars and aims to enhance trust and transparency within the Ripple ecosystem. The stablecoin’s launch has already sparked interest, with a rise in trading volume over the past 24 hours. If RLUSD gains traction, it could bolster XRP’s utility and demand, positively impacting its price.
However, recent news shows XRP facing downward pressure. This decline challenges the crucial $2 support level, which has been a key point for traders. Maintaining above this level is essential for preventing further losses and setting the stage for a potential rebound.
Analyzing Future Scenarios
Looking ahead, several scenarios could unfold for XRP. If the price sustains above $2 and breaks through the $2.48 resistance, XRP might embark on a bullish run, possibly targeting $3. Conversely, failing to maintain the $2 support could lead to further declines, potentially testing lower levels around $1.90.
Technical indicators like the MACD, currently at 0.02 with a signal line of 0.09, suggest that bullish momentum is weak but not entirely absent. The Average True Range (ATR) of 0.19 indicates moderate volatility, which could either support a breakout or exacerbate a downturn based on market forces.
Conclusion
The technical indicators present a balanced outlook, with potential for both upward and downward movements. The introduction of RLUSD is a positive development that could enhance XRP’s market position, but the current decline poses immediate challenges. Maintaining price above the $2 support level seems to be crucial for future growth.
It’s important to remember that technical analysis provides a snapshot based on historical data and current indicators. Market conditions can change rapidly, influenced by factors beyond what charts can predict. Therefore, while the technical trends offer valuable insights, they should be considered alongside broader market developments and news updates.


