Celestia (TIA) has shown a dynamic performance over recent weeks, reflecting its traders’ lively sentiments and market conditions. With a current price of $5.86 and a market rank of #55, there are some intriguing patterns emerging from the provided data.
Table of Contents
Short-Term Recovery Amidst Long-Term Decline
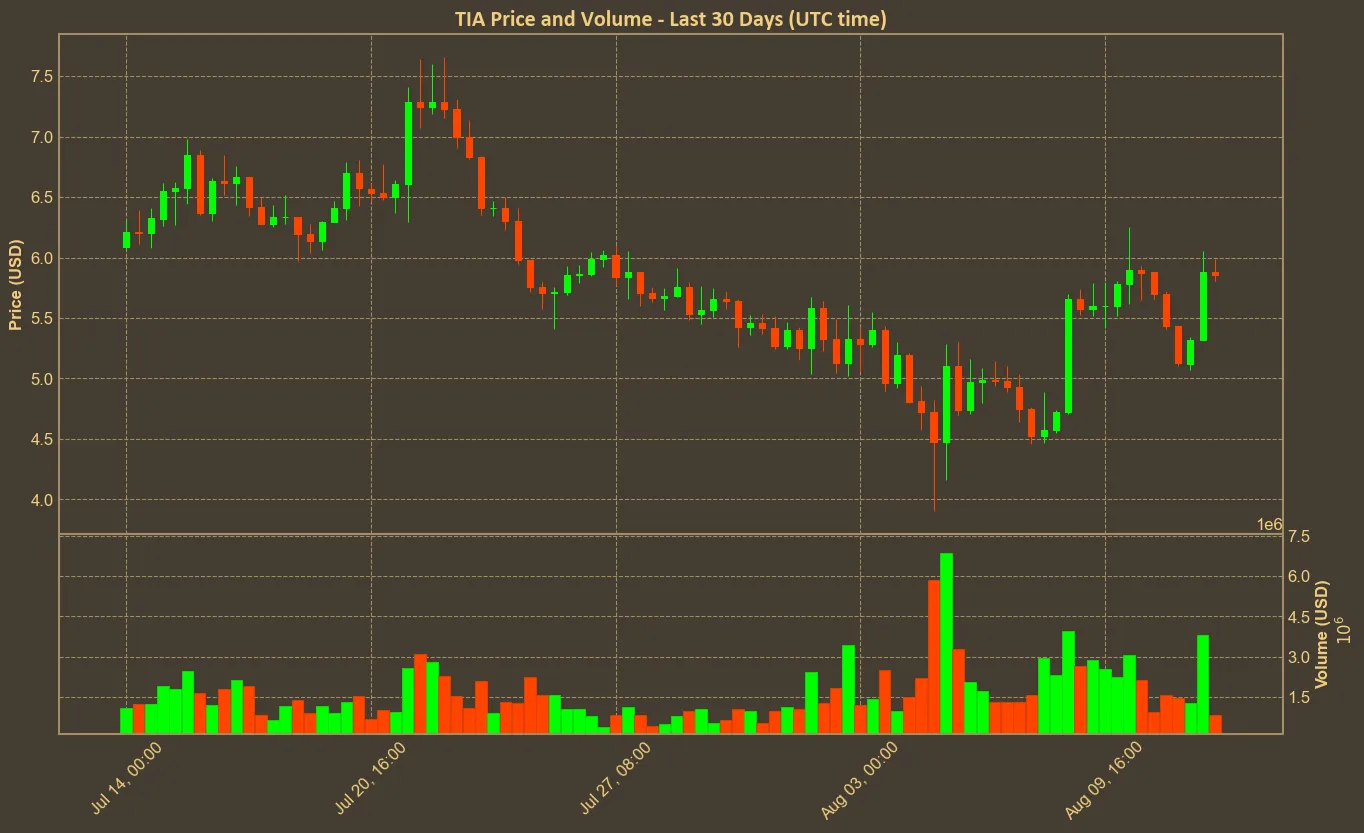
Although Celestia’s value has seen a consistent decline over the last quarter, dropping 29.39%, the short-term trend suggests a potential rebound. In the past week, the price saw a notable increase of 13.74%. The daily price change further reinforces this recovery trend, with an impressive 8.49% rise in just 24 hours. However, looking at longer time frames reveals caution is necessary. The price is still down 5.12% for the month, indicating that the current uptick may be part of a volatile consolidation phase rather than a new bullish trend.

Market Indicators: A Mixed Bag
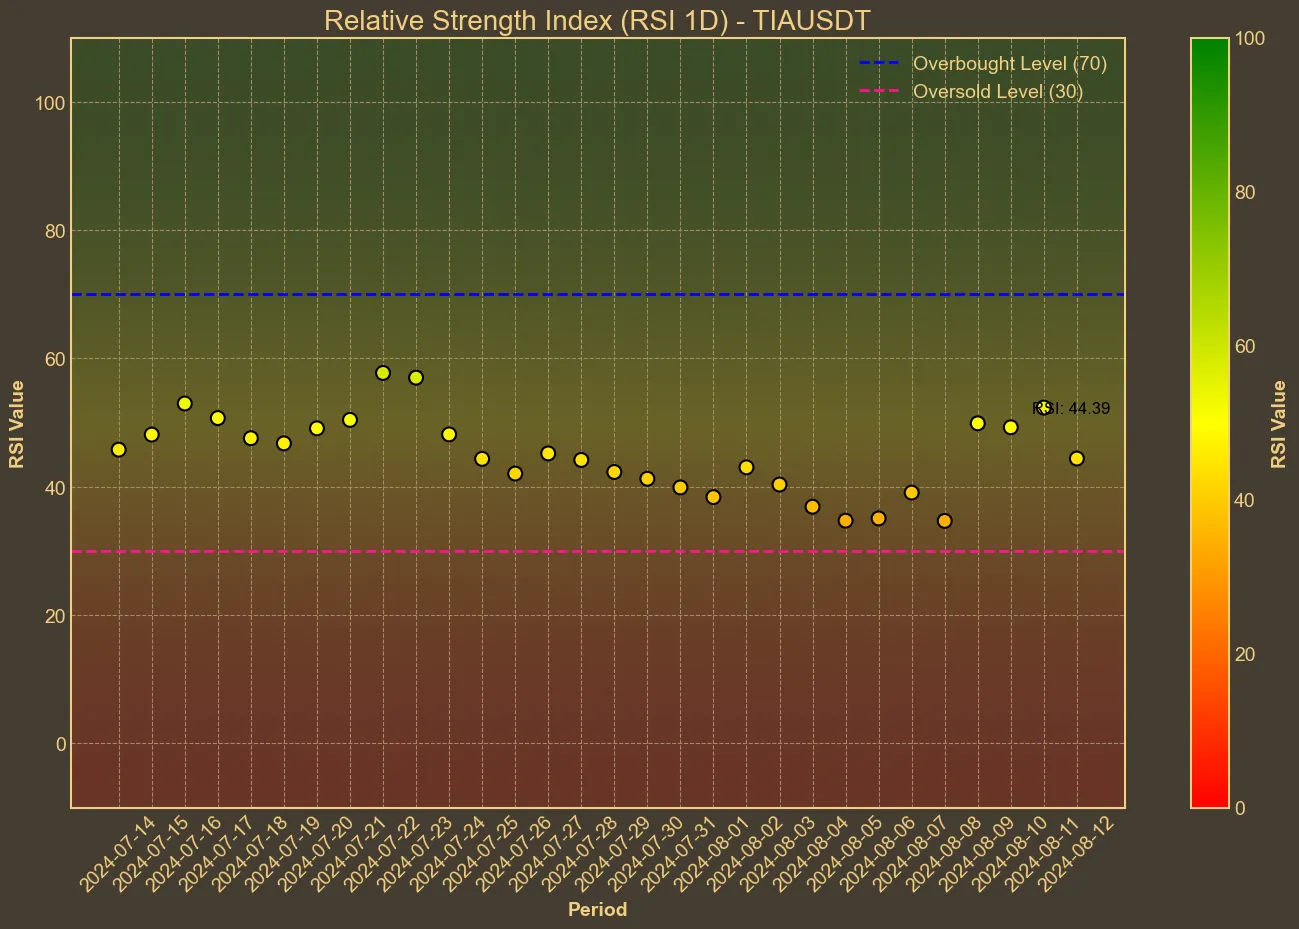
The RSI (14) offers intriguing insights. Currently standing at 52, it indicates a neutral position, closely balanced between oversold and overbought conditions. This suggests that the market sentiment is still undecided about the next significant move. Interestingly, the RSI jumped from 35 to 52 over the last week, reflecting growing buying interest.

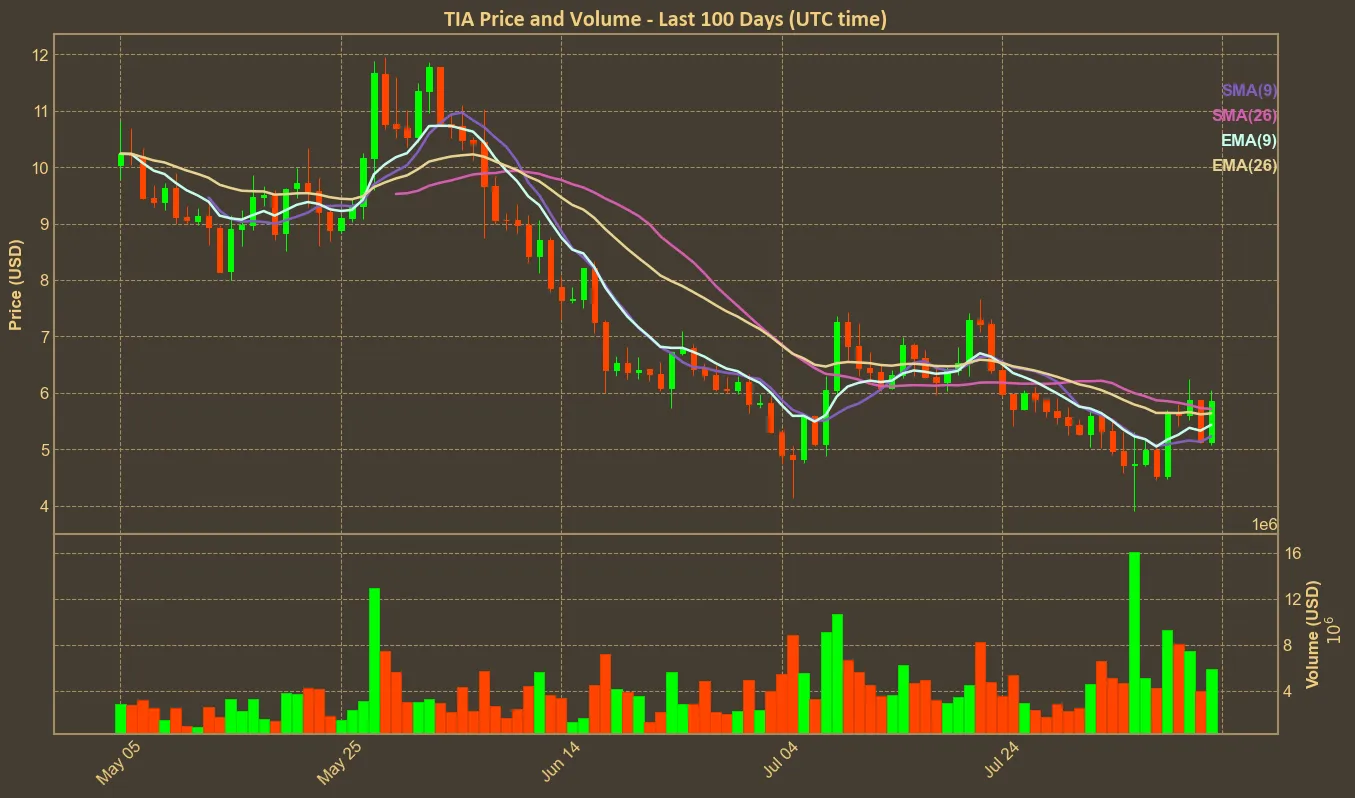
Both the simple moving average (SMA) and exponential moving average (EMA) align with this neutral stance. The SMA today is at 5.71, slightly below recent days, showing little change. Similarly, the EMA, consistent at around 5.64, confirms the absence of any strong directional momentum. The Bollinger Bands (BB), with a high of 6.3 and a low of 4.55, suggest that Celestia is hovering in the middle of its recent range.

Volatility and Momentum Indicators
Analyzing volatility and momentum indicators reveals further insights into Celestia’s potential direction. The Average True Range (ATR) stands at 0.69, indicating moderate volatility. The Awesome Oscillator (AO), moving from -0.85 a week ago to -0.4 today, signals improving bullish momentum, albeit from a negative territory.
The MACD, another vital momentum indicator, remains negative at -0.2, though above its signal line at -0.3, hinting at a possible shift towards a bullish crossover. This, coupled with a significant surge in trading volume over the last three days (up by 87.59%) and one day (up by 42.46%), supports the notion of increasing market activity, which could precede further price moves.
Conclusion: Grounded Optimism with Caveats
The recent uptick in Celestia’s price and market activity presents an emerging picture of cautious optimism. Technical indicators are showing signs of potential recovery but are far from confirming a sustained upward trend. The mixed signals – steady RSI, stable moving averages, improving AO, and recent volume increases – point to a market still searching for direction.
Investors should remember that technical analysis offers valuable insights but not certainties. Market dynamics can shift rapidly, and while data patterns are informative, they should be one part of a broader strategy that includes fundamental analysis and risk management.


