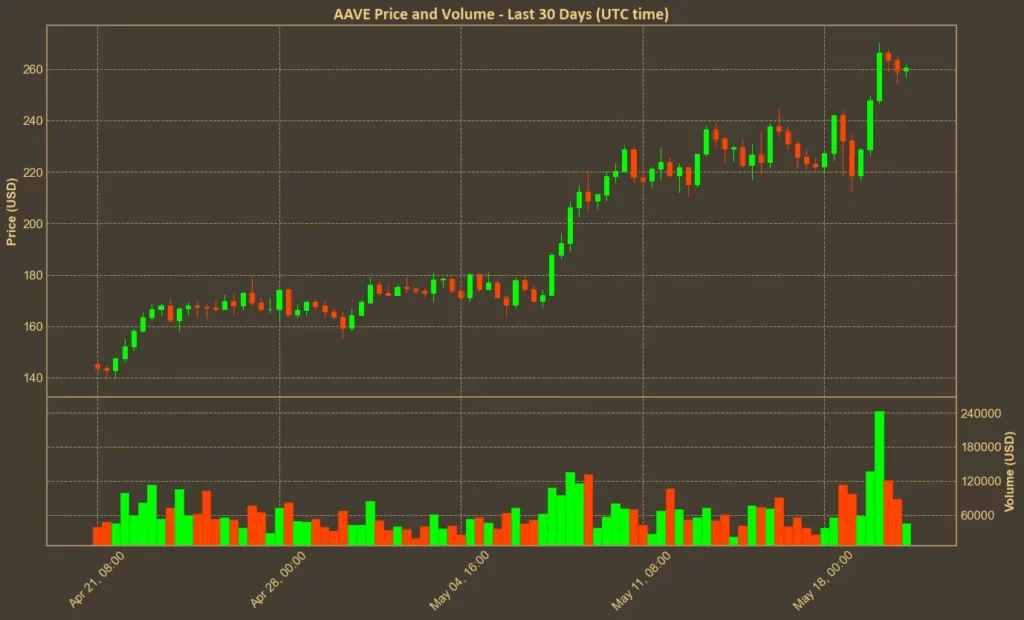
Aave is back in the spotlight after a sharp rebound in both price and interest. The decentralized lending protocol now trades at $260, gaining almost 80% in the last month alone. In the past week, it’s up more than 10%, and year-on-year the token has surged 165%.

This is not just a short-term bounce – something bigger seems to be forming. But with indicators flashing warnings, it’s time to look closer at whether the rally has more room to run, or if it’s already stretched.
Table of Contents
Click to Expand
Momentum Indicators
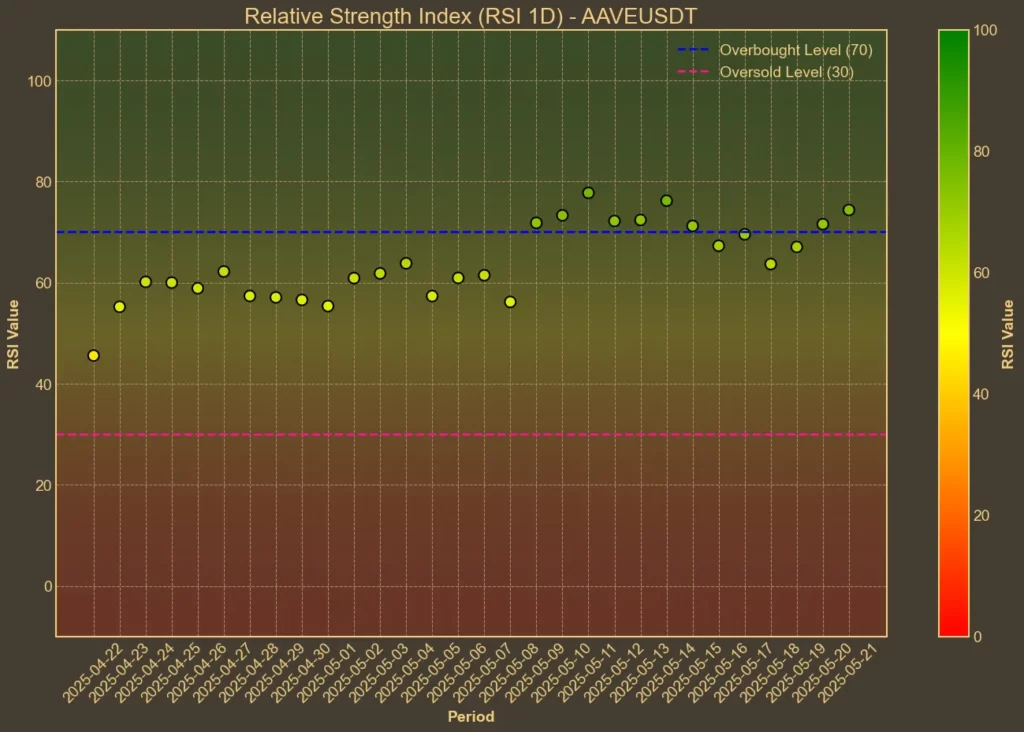
RSI: Overbought
The RSI is well into overbought territory. RSI(14) is sitting at 75, with the short-term RSI(7) even higher at 79. These numbers show strong bullish pressure – but at this level, they also suggest a risk of a pullback. If RSI stays elevated, it could support further gains. But if momentum slows, even slightly, a correction becomes more likely.

MFI: Overbought
Money Flow Index is also signaling heat. At 78 today, compared to 74 yesterday and 68 a week ago, MFI confirms that buyers have been aggressive, and the volume is supporting the rally. But high MFI, just like RSI, can mean the move is running out of steam.
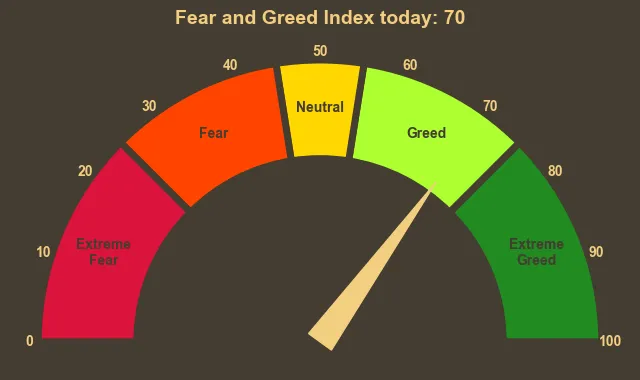
Fear & Greed Index: Greed
The broader crypto sentiment is greedy, with today’s index at 70. That’s not extreme – but it reflects confidence and optimism. The slight dip from 74 earlier in the week could show that some traders are already beginning to lock in profits.

Moving Averages
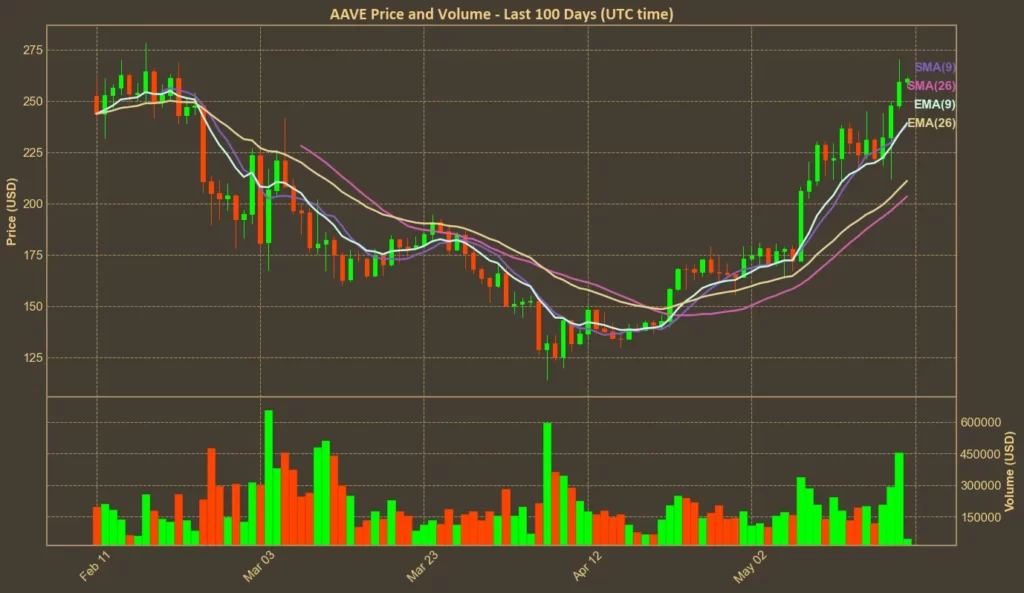
SMA & EMA: Bullish
Both short- and mid-term moving averages are comfortably below the current price. The 9-day SMA and EMA are around $238–$239, while 26-day values sit lower at $204–$211. AAVE trading above all of these confirms the bullish trend remains intact.

Bollinger Bands: Overbought
With the price hovering near the upper Bollinger Band of $272, volatility is high. Bands this wide usually follow strong price moves. Being this close to the upper band may indicate the price is stretched. It doesn’t mean a reversal is coming – but it does show that further upside could be limited unless another breakout happens.

Trend & Volatility Indicators
ADX: Strong Trend
ADX is at 41 – a clear sign of strong trend strength. A week ago, this was at 35. A rising ADX means trend momentum is growing. There’s no sign yet that the trend is weakening.
ATR: Increased Volatility
ATR is slightly down from yesterday (18.0 vs 19.0), but up from last week. That’s still high and suggests price swings are wider than usual. A volatile uptrend can bring fast gains – but also fast reversals.
AO: Weak Bullish
The Awesome Oscillator, which shows momentum shifts, has flattened – but is still positive. It was higher last week at 54, then dropped slightly and now sits at 52. The uptrend hasn’t reversed – but it may be losing steam.
VWAP: Bullish
Current VWAP sits at $189, well below the trading price. This shows traders have been paying a premium – another sign of strong bullish momentum.
Relative Performance
Comparison Against BTC: Bullish
AAVE is not just rising in dollar terms. It’s also gaining against Bitcoin. The AAVE/BTC ratio is up nearly 10% this week and over 43% in the past month – that’s a major outperformance.
The Bigger Picture
The rally hasn’t come out of nowhere. Aave’s total value locked (TVL) is now over $40 billion – a record for the protocol, and more than 20% of the entire DeFi market. New launches and regulatory shifts in the U.S. have helped as well. The GENIUS Act, which is gaining traction, would make it easier for DeFi projects like Aave to operate.
Institutional demand, governance proposals, and rising protocol usage all suggest that the move isn’t purely speculative. Still, the technical indicators are clear: AAVE is hot, and the rally may be starting to overheat.
Final Thoughts
Most indicators are still leaning bullish, but many are flashing overbought. RSI, MFI, and Bollinger Bands all hint at a potential cooldown. The uptrend is strong, and buying pressure remains – but we’re entering a stage where late entries could carry more risk.
As always, technical analysis has limits. It doesn’t capture sudden market shifts, external news, or whale moves. Right now, AAVE looks like a strong asset with a real use case and a wave of support behind it. But after this kind of run, buyers should be more selective.
Read also: Mantra Struggling Below $0.50 – Bearish Signals Persist


