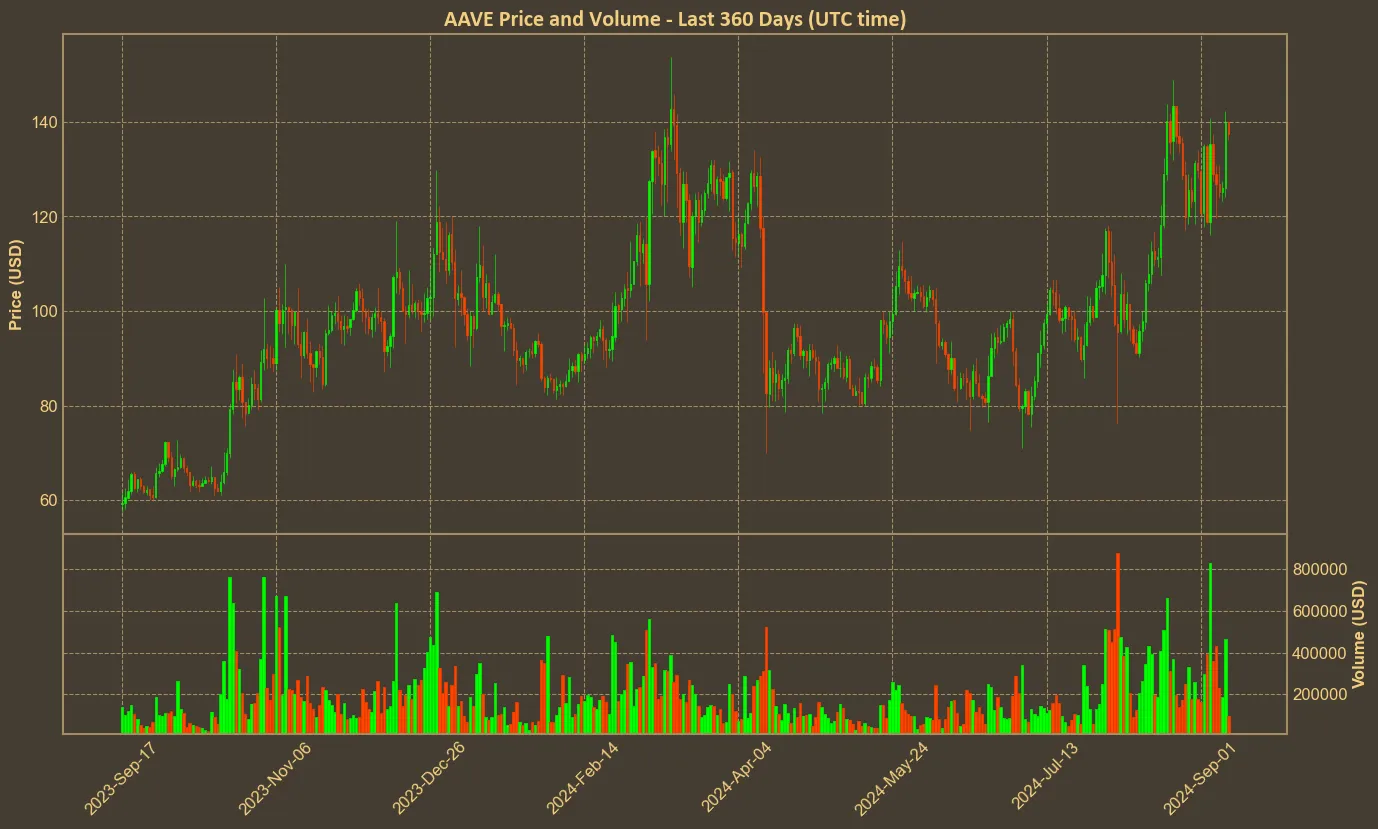
In the decentralized finance (DeFi) sector, Aave continues to stand out, attracting attention with its impressive growth. Recent data reveals a significant upward trend in Aave’s price, with a 44% increase over the past month. This momentum is further underscored by a 55% rise over the last quarter and a remarkable 157% surge in the past year. Aave’s growth reflects rising investor interest and its increasing integration within the broader financial ecosystem.

Despite recent volatility in the crypto markets, AAVE is currently trading at around $140, approaching its March highs. It’s been a strong year for the token, though it’s still well below its 2021 peak when it exceeded $600.
Market Activity and Technical Indicators
Aave’s market cap currently stands at $2.05 billion, with a trading volume of $0.42 billion. The market cap experienced a slight dip over the past 24 hours and three days, yet a robust 47% surge over the month signifies sustained investor confidence. Volume trends are even more telling; while there was a decrease in the daily and three-day periods, the seven-day and 30-day data show exponential increases, up by 102% and 278% respectively. This suggests Aave is drawing significant trading activity, possibly from both new and returning investors looking to capitalize on its positive sentiment.
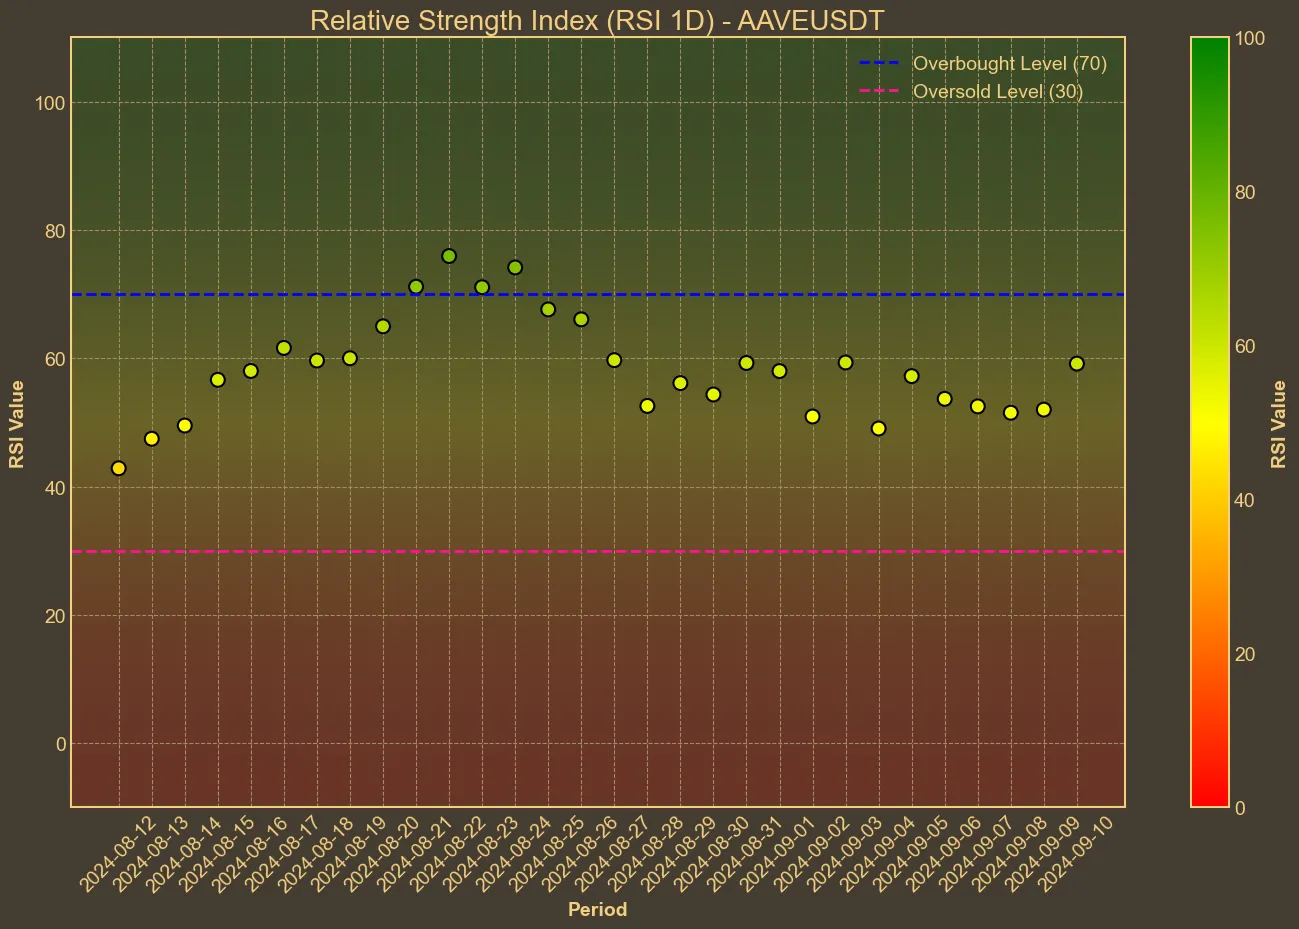
Technically, Aave is showing strong bullish signals. The Relative Strength Index (RSI) has climbed from 49 to 57 over the past week, edging closer to the overbought territory. This indicates strong buying pressure, especially notable given that the broader crypto market is recently in a “Fear” phase, according to the Fear and Greed Index. Historically, AAVE has shown a low correlation with Bitcoin, making it somewhat of an outlier in terms of performance.
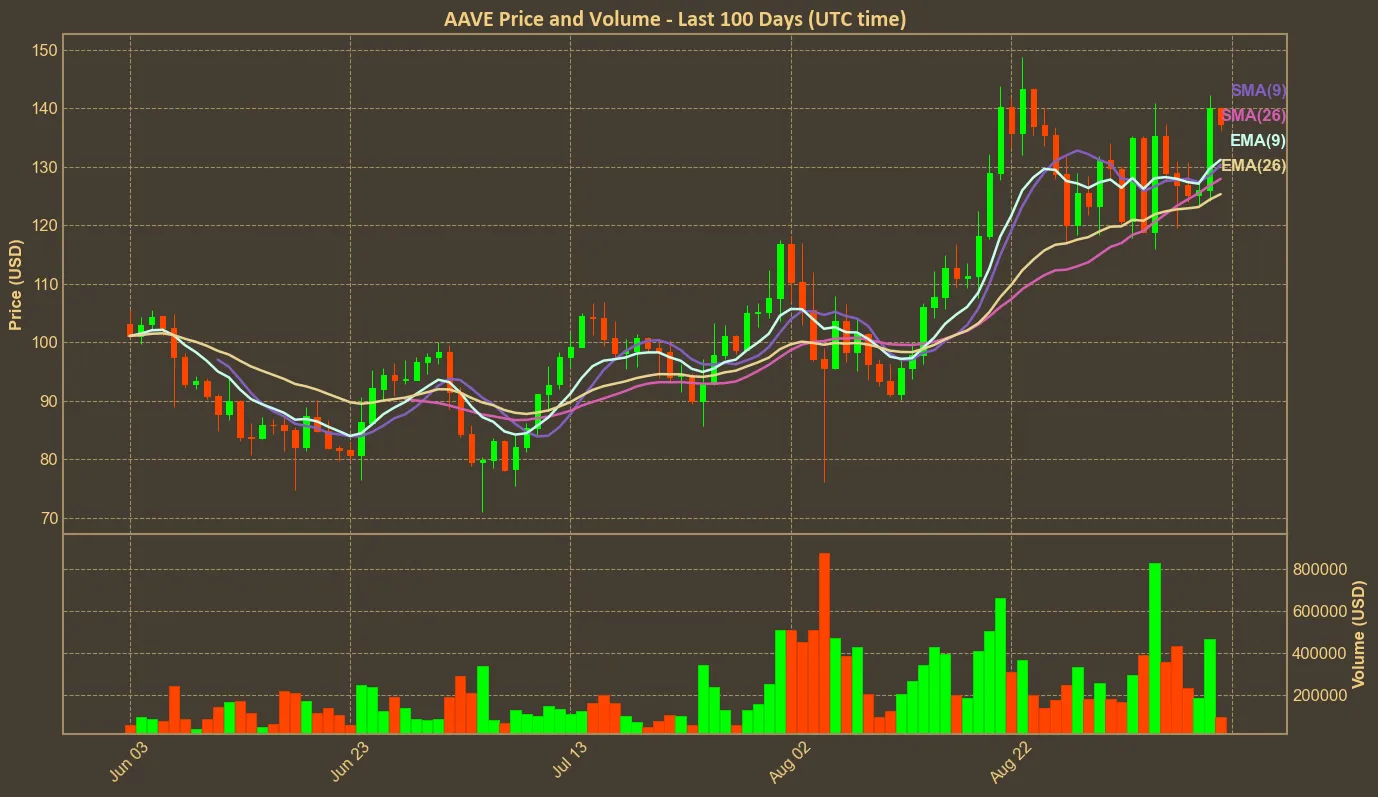
 Simplified Moving Averages (SMA) and Exponential Moving Averages (EMA) are also demonstrating upward trends. The SMA increased from $121 a week ago to $128 today, while the EMA has remained relatively stable yet supportive. Another key indicator, Bollinger Bands, shows a relatively wide gap between the high ($144) and low ($117), suggesting a high degree of price volatility but within a sustained upward trend.

Broader Implications
While Aave’s recent performance and technical indicators point to continued growth, it’s important to remember that technical analysis has its limitations. External factors, such as economic data, Federal Reserve interest rate decisions, or political developments, could impact the market at any time. Additionally, regulatory changes are always a potential risk; for example, just days ago, Uniswap, another major DeFi player, was fined $175,000 by the CFTC.
Nevertheless, Aave’s consistent positive price performance and strengthening market metrics suggest a healthy underlying foundation. The strong growth in volume and market cap, alongside supportive technical indicators, points to a bullish outlook. However, investors should remain cautious, as the crypto market is known for its unpredictability. A balanced approach with mindful analysis is key to navigating these market conditions.


