Aave has been climbing steadily, with a 60% gain over the past quarter and a current price holding near $275. The protocol remains one of the strongest in DeFi, and technical indicators mostly support that view.
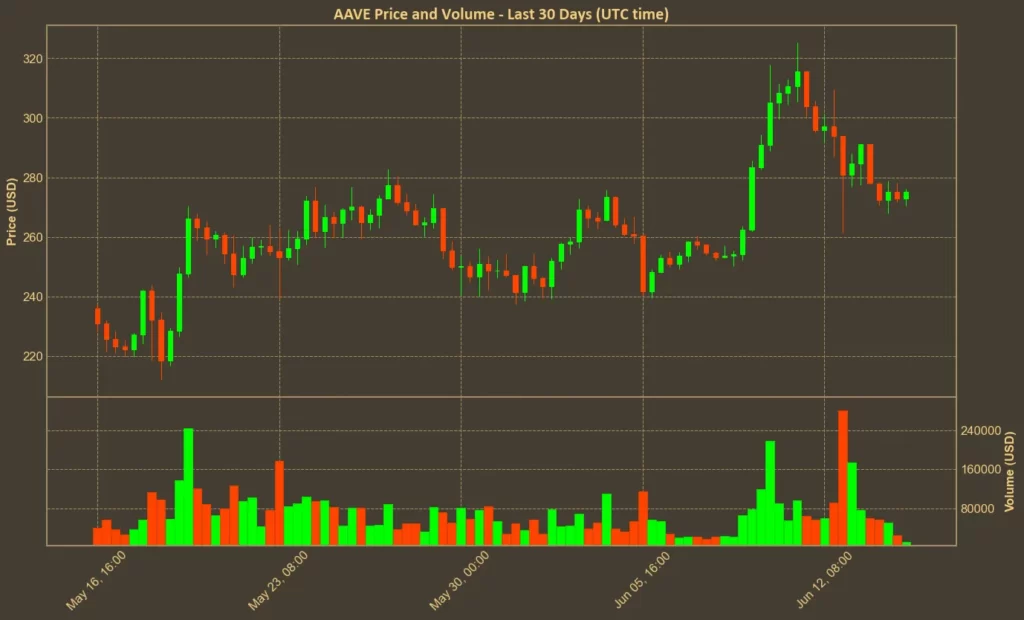
The only area that stands out is volume – which has been shrinking fast. Trading activity dropped by over 30% this month and nearly 70% in the last week. That drop in engagement could limit the pace of further gains unless new interest returns. But based on the charts alone, the setup still leans in favor of the bulls.
Table of Contents
Click to Expand
Momentum Indicators
RSI: Neutral
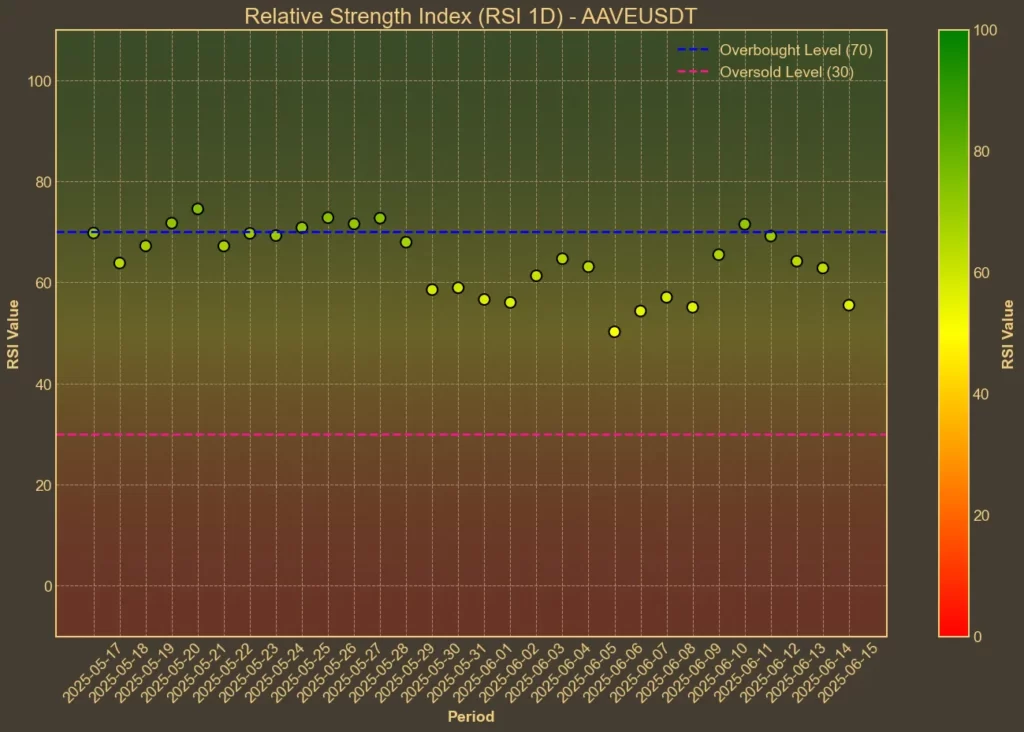
RSI is used to check whether a coin is overbought or oversold. The current RSI(14) is 56, nearly unchanged from last week. Short-term RSI(7) is right at 49 – a balanced level with no strong signal either way. This places Aave in a neutral zone. There’s no sign of overheating, but also no strong buy pressure.
MFI: Neutral
The Money Flow Index uses both price and volume to assess momentum. MFI(14) climbed to 52 from 44 last week. That’s a steady shift upward, showing some healthy inflows. It supports the idea that recent buyers are still active, even if overall volume is shrinking.
Fear & Greed Index: Greed
The broader market sentiment, measured by the Fear & Greed Index, is at 60 – slightly greedy, but lower than the highs seen earlier in the week. While the tone remains risk-on, the mood is less aggressive than a few days ago. This could explain why Aave has cooled just below the $280 level.

Read also: How To Use Crypto Fear and Greed Index To Your Advantage?
Moving Averages
SMA & EMA: Bullish
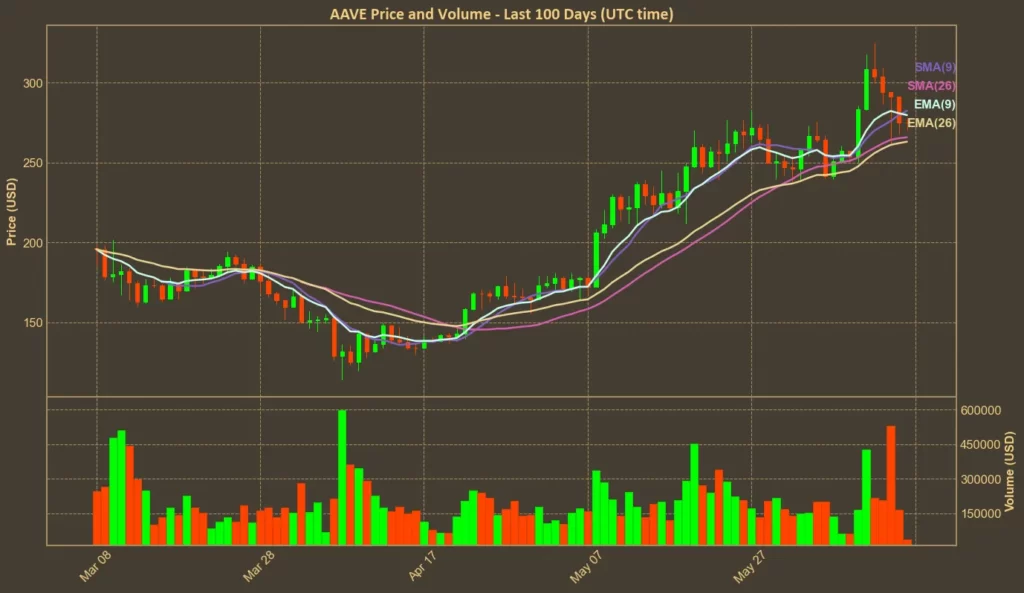
Short-term averages confirm that Aave is in an uptrend. SMA(9) and EMA(9) are above $280, with the price slightly below that mark – suggesting consolidation. Longer-term averages are lower, which confirms upward pressure remains intact. It’s a classic bullish setup, though the price will need to break $285 again to confirm further strength.
Bollinger Bands: Increased Volatility
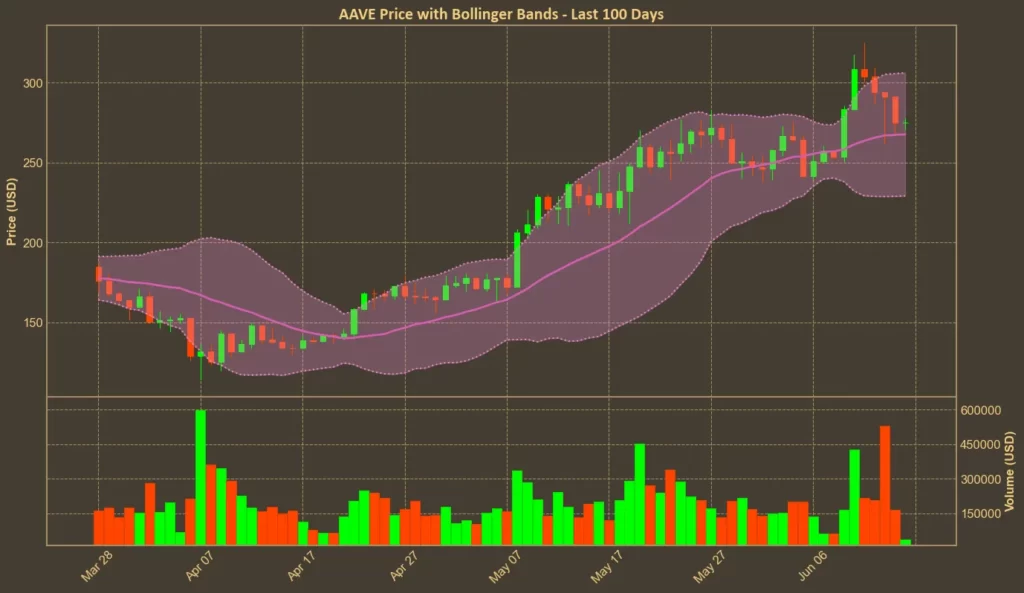
The current price is moving between $229 and $306. Aave is hovering closer to the upper band, signaling mild overbought conditions. That usually means more volatility is ahead, and a pullback or breakout is both possible. With volume falling, a break higher might struggle without new demand.
Trend & Volatility Indicators
ADX: Neutral
ADX at 27 shows a trend is in place, but it’s not particularly strong. The indicator has held around this level for a week, suggesting buyers are present but not dominant. If ADX climbs above 30, that would show a stronger bullish trend forming.
ATR: High Volatility
ATR at 20.0 signals higher volatility. While it’s come down slightly from yesterday, it’s still above levels seen last week. This supports the idea that price swings are getting wider- often a sign of hesitation or battle between bulls and bears.
AO: Bullish
The Awesome Oscillator is positive, at 31.0. Even though it’s lower than yesterday, the trend is still upward. Compared to last week’s 16.0, this indicator is clearly supporting momentum in favor of the bulls.
VWAP: Bullish
Aave’s VWAP sits at $200. That’s far below the current market price, which means recent buyers are still in profit. This acts as a strong psychological support zone and suggests bulls still have room to defend dips.
Relative Performance
Comparison Against BTC: Bullish
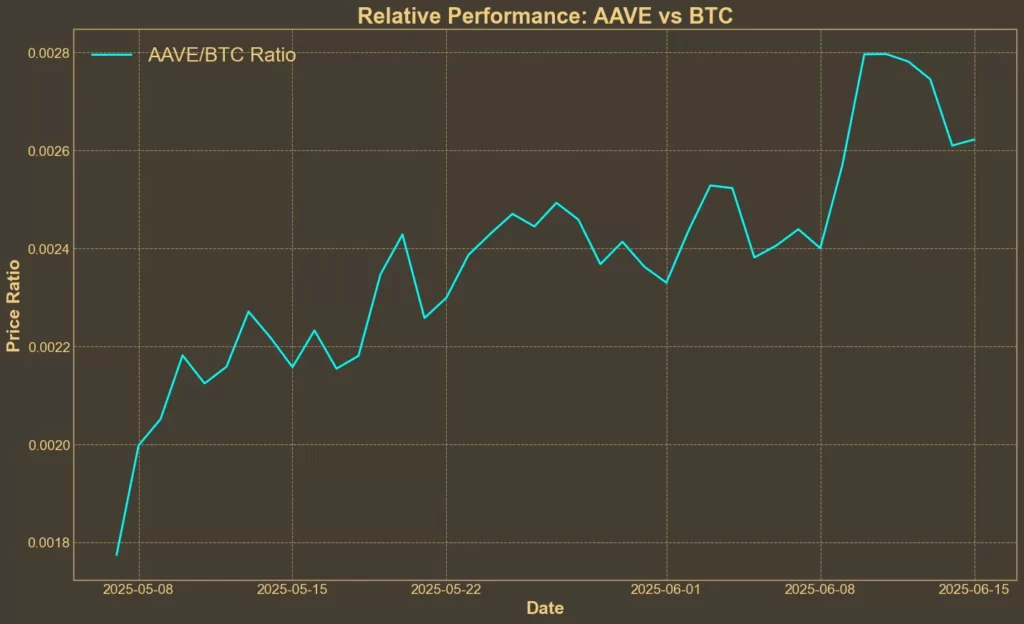
The AAVE/BTC ratio is up nearly 10% over the past week, and over 21% in the past month. This is a clear signal of relative strength. While Bitcoin has shown signs of slowing, Aave is outperforming it – not just in price but in pace. That makes it more attractive for short-term rotation trades.
Final Thoughts
Aave looks technically solid – but not unstoppable. Indicators are mostly bullish or neutral. The main issue right now is volume, which is dropping across every time frame. That disconnect between price growth and volume could limit further gains unless something reignites interest.


