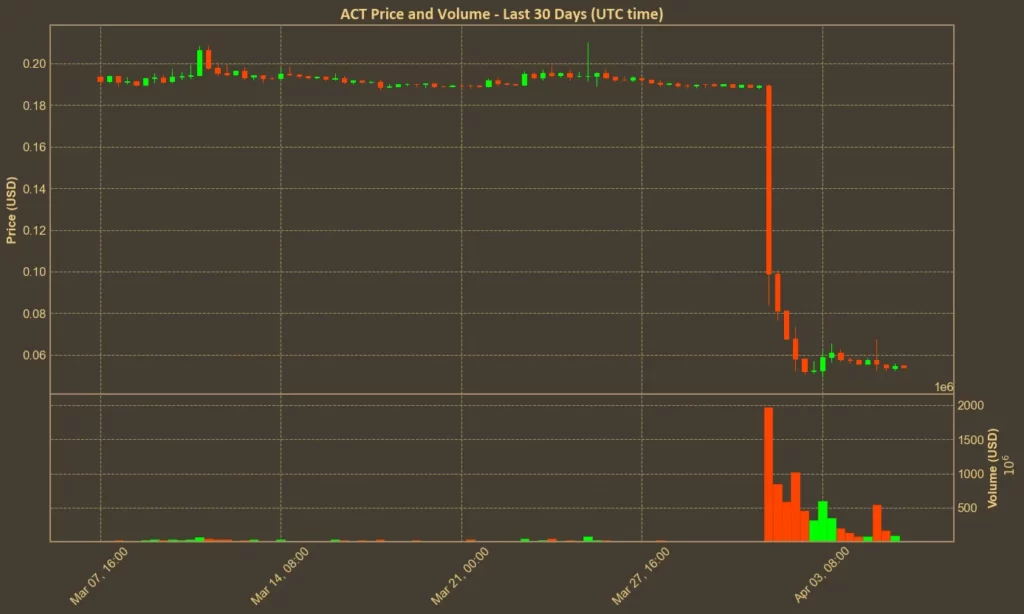
After the dramatic crash on April 1 that sent ACT plunging over 50%, the coin has struggled to regain direction. Once hyped for its narrative around AI and storytelling, ACT now finds itself battling a harsh correction and a crisis of confidence. The technical indicators, taken together, suggest more pain in the short term – but also potential for volatility-driven rebounds.

Table of Contents
Momentum Indicators
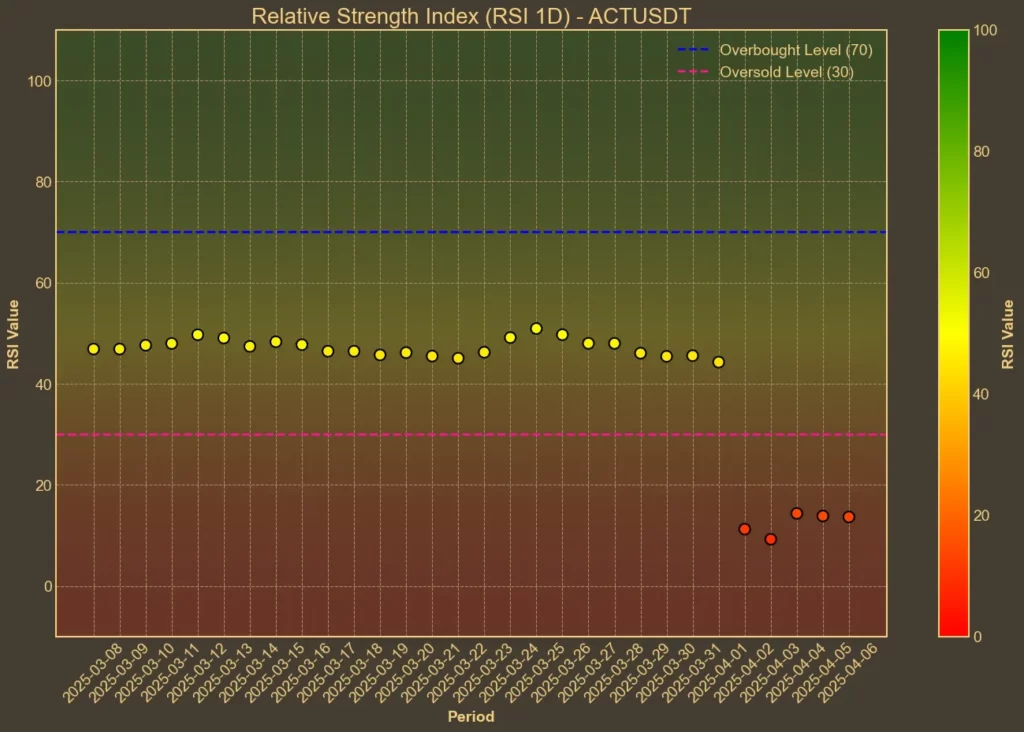
RSI: Oversold
The Relative Strength Index shows extreme weakness. RSI(14) is at 14, and the short-term RSI(7) is even lower at 9. This suggests that selling has been aggressive and sustained. Conditions like these often precede a bounce, but without a shift in sentiment, they can persist.

MFI: Oversold
The Money Flow Index adds another layer of concern. With MFI(14) at just 5, the volume-adjusted pressure is clearly on the sell side. Both MFI and RSI in this zone are rare and usually don’t stay this low for long. Still, low doesn’t mean bottomed – just stressed.
Moving Averages
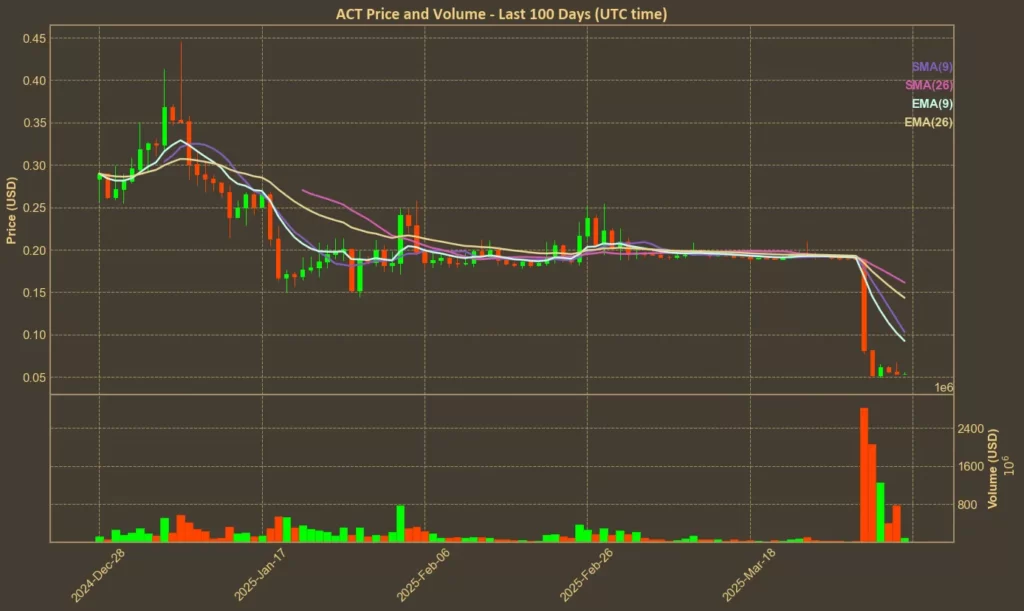
SMA & EMA: Bearish
The price is well below both short- and long-term moving averages. The SMA(9) and EMA(9) are far above the current price, with longer-term SMA(26) and EMA(26) even higher. This separation shows just how deep the drop has been. It also means there’s no nearby support from averages – the coin is in free space.

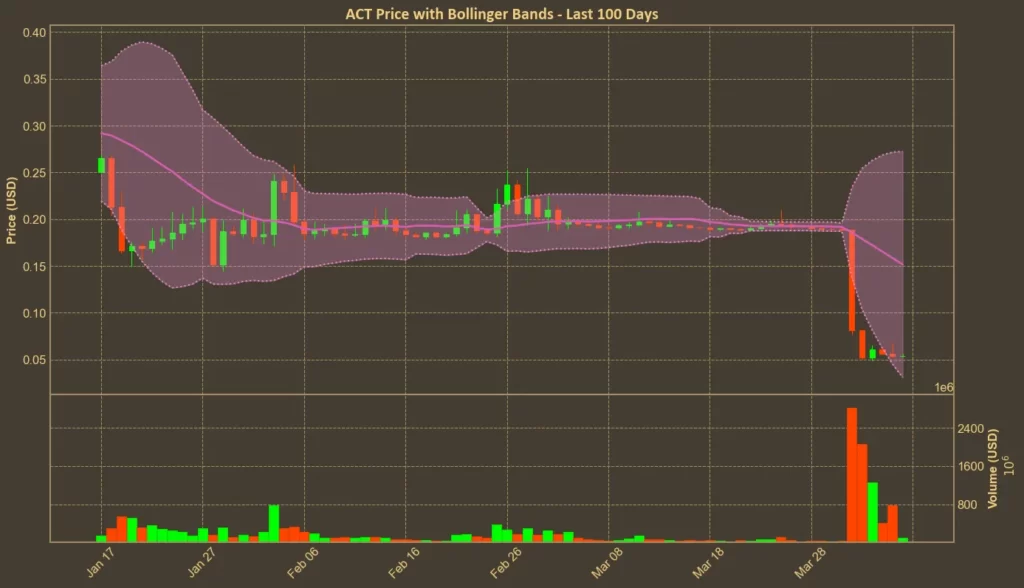
Bollinger Bands: Increased Volatility
The lower Bollinger Band is at $0.0307 – close to the current price – while the upper band is still far away at $0.2725. This setup reflects how explosive the drop was, and how wide the volatility range has become. The coin is sitting near the bottom, but there’s no obvious bounce setup unless traders return fast.

Trend & Volatility Indicators
ADX: Strong Trend
ADX(14) has climbed to 47, showing a strong trend – but it’s a downtrend. The increase from last week confirms that this is not just a short-term correction. The trend has intensified and hasn’t slowed down yet.
ATR: High Volatility
Average True Range confirms what the charts already suggest: volatility is up. ATR(14) is at 0.0152, almost double what it was a week ago. This means the price is swinging more wildly – good for day traders, but nerve-wracking for holders.
AO: Bearish
The Awesome Oscillator remains deep in negative territory at -0.1122. Momentum continues to favor sellers, and no signs of reversal have emerged yet.
VWAP: Bearish Divergence
Price is trading far below the VWAP of 0.1763. That gap suggests traders are now treating ACT as something very different from just a week ago. This indicator, too, points to a market that has sharply repriced expectations.
What This All Means
The overall image is not bullish. Momentum indicators say the coin is oversold. Trend indicators say it’s not done falling. Moving averages and VWAP show the price is far below any recent support levels. In short, ACT is in freefall – and while that doesn’t mean it can’t bounce, the indicators offer no reason to expect a real recovery just yet.
That being said, technical analysis can’t predict surprise catalysts. A new listing, a strong update from the team, or a coordinated whale buy could shift sentiment quickly. And in this case, the ACT team has spoken.
Shortly after the collapse, the ACT project issued a public statement to clarify what happened. They pointed to recent changes made by Binance to margin and leverage tiers, which were applied with only a few hours’ notice. These adjustments forced several large traders to unwind their positions rapidly, leading to a cascade of liquidations:
The team emphasized that there was no exploit, rug pull, or project-level failure behind the crash. ACT’s tokenomics remain unchanged, with the full circulating supply already live on the market.
What matters now is what comes next. The ACT team reaffirmed their long-term focus on building AI-driven infrastructure within the Web3 ecosystem. They’re set to showcase progress later this month at Token2049. For some holders, that might offer a fresh anchor of confidence. But for traders looking at the chart, there’s still a gap between long-term vision and short-term price action.
Technicals reflect behavior, not belief. Right now, they paint a picture of stress and uncertainty, not recovery. While the team’s response has been measured and transparent, sentiment will take time to rebuild.


