Avalanche (AVAX) has been under pressure for months, but recent price action suggests it might finally be building a base. The token has rebounded sharply in the past thirty days, gaining more than 34%, and now trades at $22. While it’s still far below its earlier highs, the momentum shift is clear. The market cap has increased by 34% in the past month as well, and daily trading volume has more than doubled in the past week.
The recent bounce doesn’t erase the losses – AVAX is still down 35% year-over-year and 85% below its all-time high. But short-term momentum is improving, and with broader crypto sentiment turning positive, this might be the start of a bullish uptrend
Table of Contents
Click to Expand
Momentum Indicators
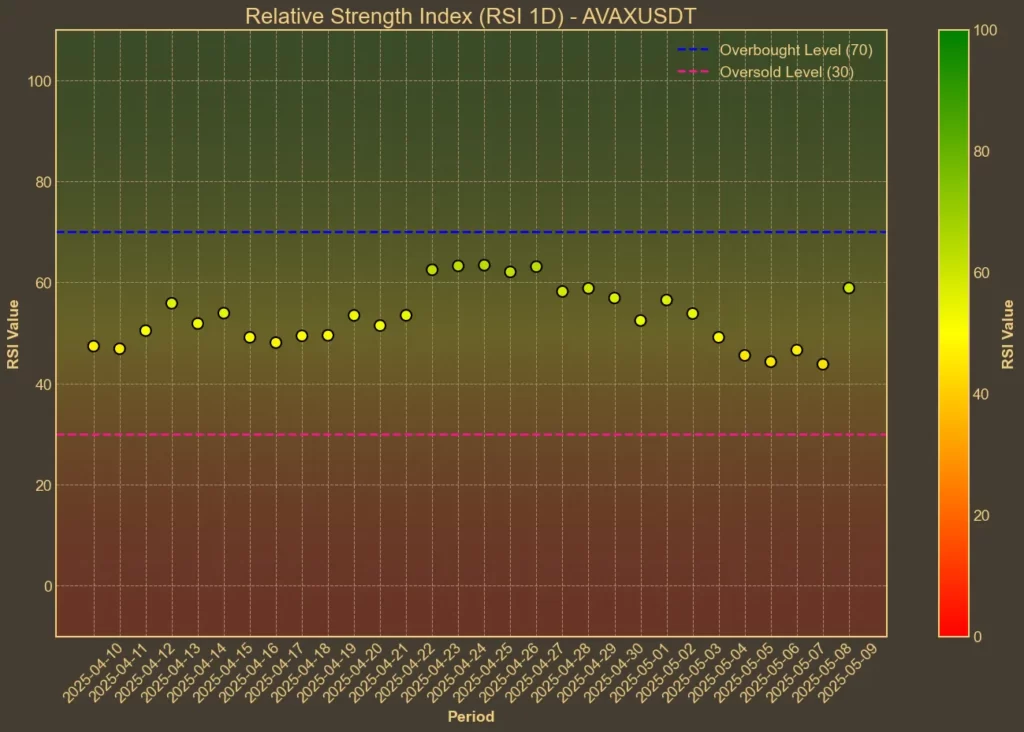
RSI: Neutral
The Relative Strength Index is currently sitting at 59 on the standard 14-day setting. That’s below the threshold where traders start to worry about overbought conditions. The short-term 7-day RSI reads slightly higher at 64, suggesting momentum is picking up – but not to the point of excess. The numbers haven’t moved much in the past two days, which shows stability, not hype.

MFI: Neutral
The Money Flow Index, which combines price and volume, is at 47. It was 63 a week ago. That’s a noticeable drop, meaning money is flowing into AVAX at a slower pace. It’s not bearish – but it does suggest that the early rush has paused. This isn’t always a bad sign – sometimes, consolidations like this set the stage for the next move.
Fear & Greed Index: Greed
Fear and Greed Index tracks sentiment across the entire crypto market, not just Avalanche. Today’s reading is 73 – a high number. It jumped from 52 over the past week, which usually happens when investors start chasing rallies – and we’ve seen strong bullish momentum across the market lately.

Moving Averages
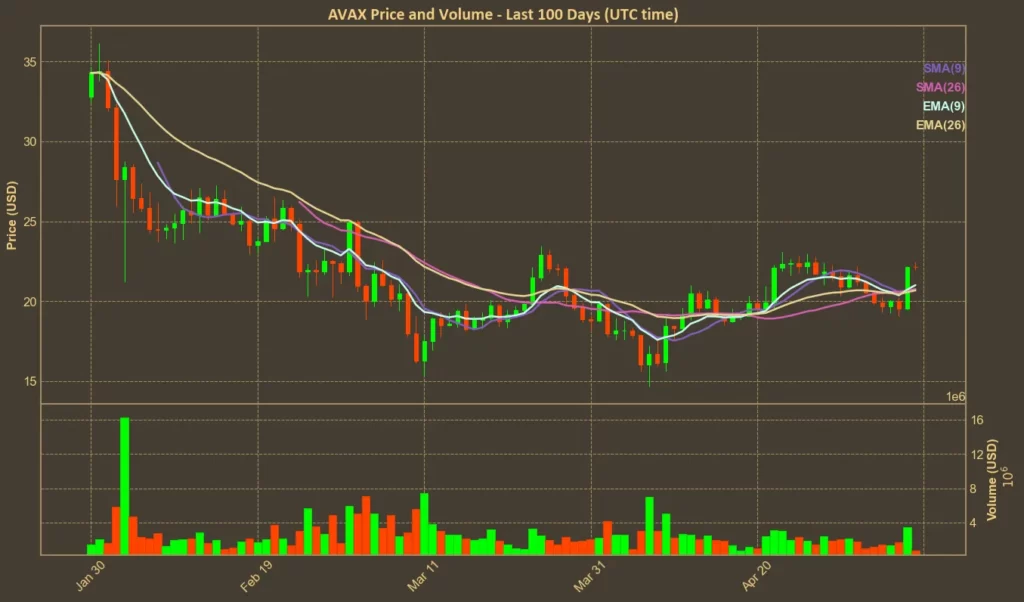
SMA & EMA: Bullish
AVAX is currently trading above both its 9-day and 26-day moving averages, whether you use simple or exponential calculations. The SMA(9) is 20.76 and EMA(9) is 21.0 – both under today’s price. Longer-term 26-period averages also lag current price. That puts Avalanche in a bullish alignment on the chart. The last time this crossover happened, it led to a strong move higher. That said, the gap isn’t wide – the trend needs to keep going or risk flattening out.

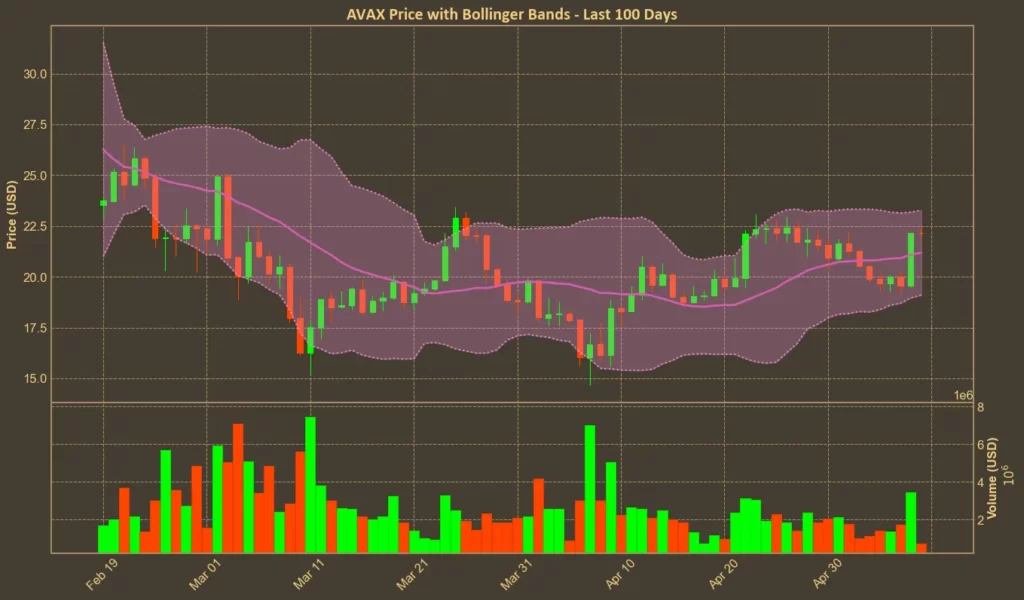
Bollinger Bands: Moderate Volatility
Today’s Bollinger bands show a range between $19.1 and $23.3. The price is near the top of that range, which implies limited short-term upside unless volatility expands. Being close to the upper band can sometimes mean the asset is getting ahead of itself, though in this case, it’s not yet at an extreme level.

Trend & Volatility Indicators
ADX: Weak Trend
The ADX reading is 17 – that’s low. In practical terms, it means there isn’t a strong trend in place. AVAX is moving higher, but the move doesn’t have full conviction from trend-followers. It could still strengthen – but for now, the rally is mostly driven by sentiment and momentum, not by structured long-term buyers.
ATR: Decreasing Volatility
The Average True Range is at 1.27, down from 1.35 a week ago. This confirms what Bollinger Bands already suggested – volatility is easing. Lower volatility often comes before bigger price shifts, but it also means that traders might be taking a break.
AO: Mildly Bullish
The Awesome Oscillator is at 0.34 – up from near zero yesterday. That shows growing bullish momentum, but nothing explosive. It supports the idea that AVAX is recovering in a steady, controlled way rather than a speculative surge.
VWAP: Positive
Today’s volume-weighted average price is 21.74, which is under the current price. That’s a good sign – it means today’s buyers are paying above average, suggesting the willingness to accumulate rather than dump.
Relative Performance
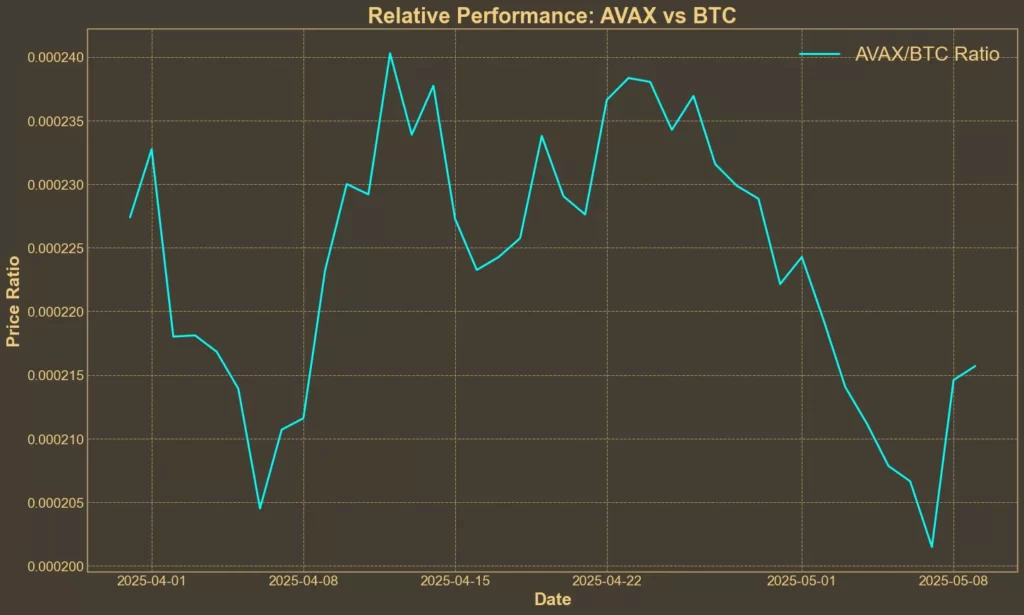
Comparison Against BTC: Underperforming
AVAX/BTC is down more than 6% in the past month and has dropped nearly 2% this week. That confirms what many traders already suspect: Avalanche is gaining in dollar terms, but losing ground to Bitcoin. It’s recovering, but not fast enough to keep up with the strongest coins. In absolute terms, this is fine – but in crypto, relative performance often decides whether traders rotate in or out.

Summary
Most indicators suggest cautious optimism – price is holding above support, volume is increasing, and momentum is positive but not overheated. The lack of a strong trend or volatility means traders should expect a slower move unless a new narrative appears.
Like always, technical analysis can only reflect current market behavior – it doesn’t predict the future. If fundamentals shift or broader risk appetite changes, these setups can break down quickly.
Read also: Nasdaq Files For Avalanche (AVAX) ETF


