Beam has had a turbulent journey recently, ranking #80 in the cryptocurrency market. Today’s data presents Beam as one of the most gaining cryptos – we analysed its current technical indicators and price movements to gauge potential future trends.
Price and Market Trends
In the past month, Beam has experienced a significant downward trend, with a price decrease of almost 15%. This decline continues when looking at the quarterly performance, showing a staggering drop of over 47%. However, within the last day, Beam’s price has surged by 6.37%, differentiating it from other cryptocurrencies today. This increase suggests possible short-term interest or speculative trading activity.
The market cap over the last week has grown by almost 10%, suggesting that despite its struggles, there’s increasing investor confidence or interest. This growth in market cap, paired with a volume surge of nearly 88% in the past seven days, indicates heightened trading activity.
Technical Indicators Analysis
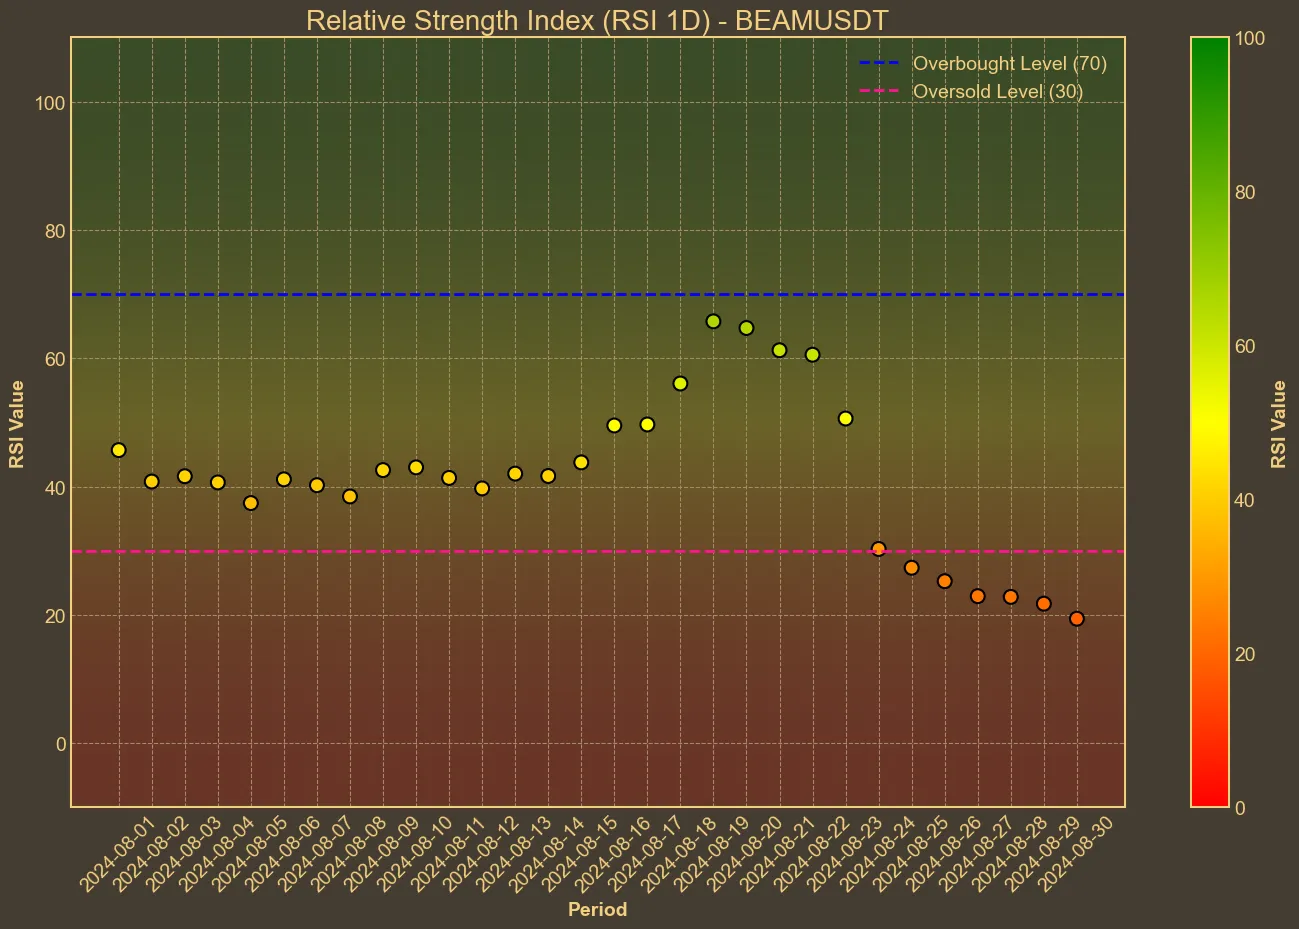
Taking a deeper dive into Beam’s technical indicators, the values paint a vivid picture of its market behavior. The Relative Strength Index (RSI), sitting at 19 today, indicates that Beam is currently oversold. This level suggests that Beam could be undervalued, possibly attracting buyers looking for entry points at low prices. The Moving Averages, both Simple (SMA) and Exponential (EMA), show a consistent decline over the past week. This trend is a red flag and hints at a bearish sentiment in the market. With the SMA and EMA significantly below recent averages, it reinforces the overall downtrend.

Analyzing the Moving Average Convergence Divergence (MACD) and Awesome Oscillator (AO), both indicators suggest bearish momentum. The MACD value at -0.0121, with a signal line at -0.0074, implies a negative outlook, while the AO’s continuous decline over the last week further supports this bearish sentiment. Additionally, the Bollinger Bands indicate a wide range, which reflects the high market volatility.
Conclusion and Evaluation
Beam’s recent price trajectory and technical indicators reflect a complex picture. While the market cap and volume suggest there may be underlying interest and speculative potential, the RSI, MACD, and other indicators point to caution. For potential investors, it’s essential to be aware of the limitations of technical analysis. External factors, fundamentals, and broader market movements can all impact Beam’s future trends. Given the mix of bullish short-term activity and bearish long-term indicators, those contemplating investment should weigh these conflicting signals carefully. The shifting dynamics in Beam’s landscape underline the importance of ongoing, adaptable analysis.


