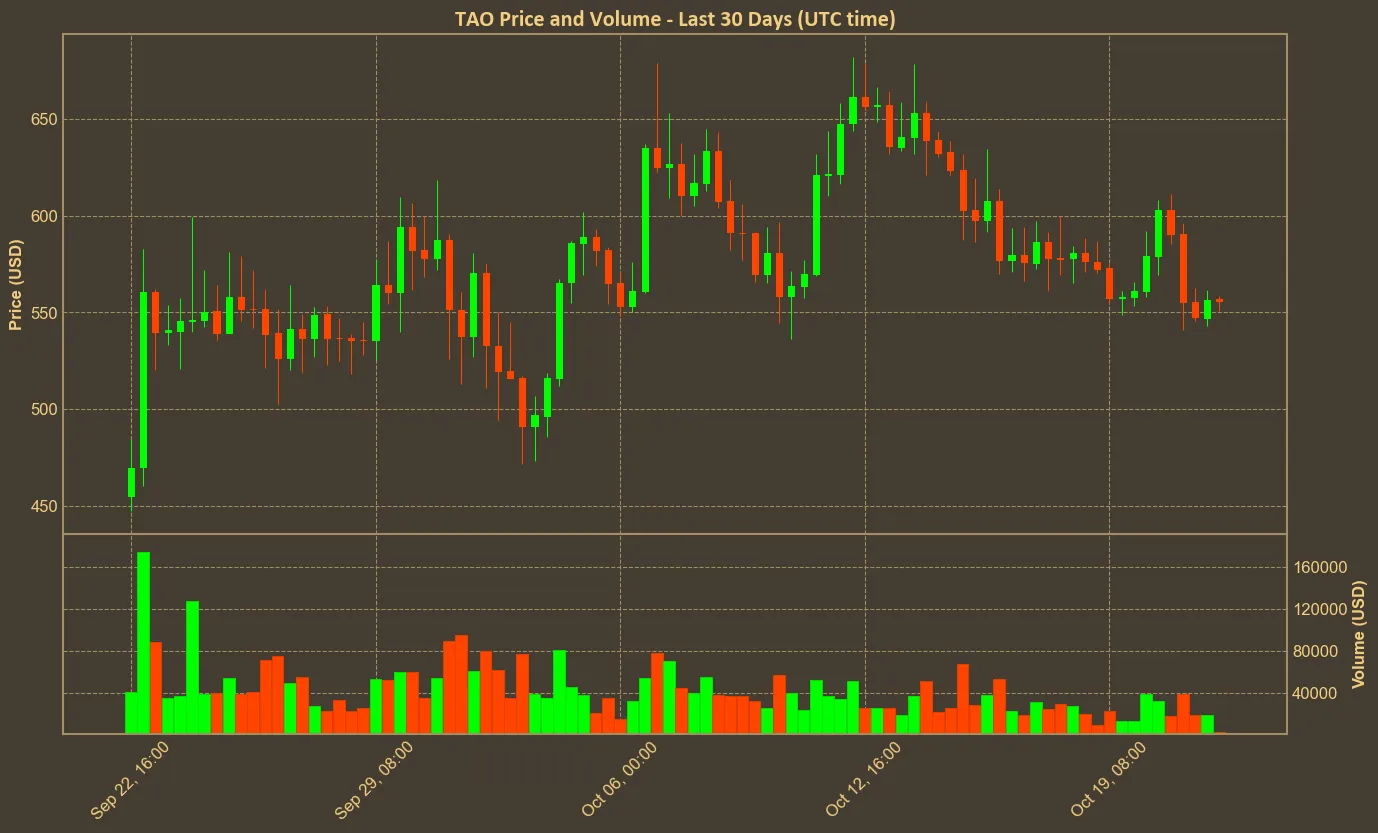
Bittensor (TAO) has been a major in the world of AI-focused cryptocurrencies, capturing attention with impressive growth over the last year. Recently, however, it has seen short-term declines, indicating both the potential and volatility within its trading environment.

Technical Indicators and Market Mood
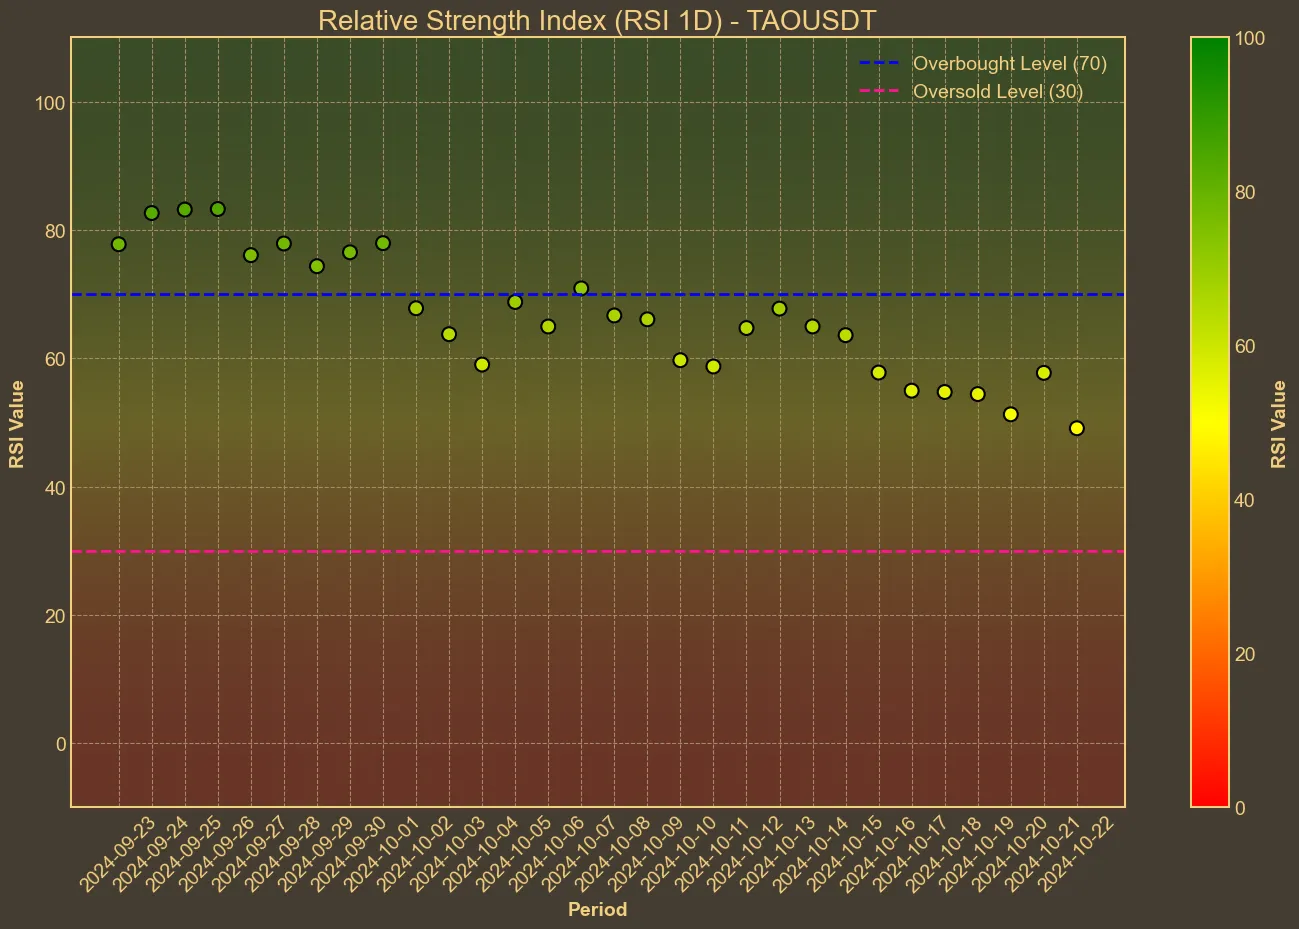
When examining Bittensor’s technical indicators, the data paints a picture of a coin experiencing mixed momentum. The Relative Strength Index (RSI) hovers around 50, suggesting a neutral market sentiment without immediate buying or selling pressure.

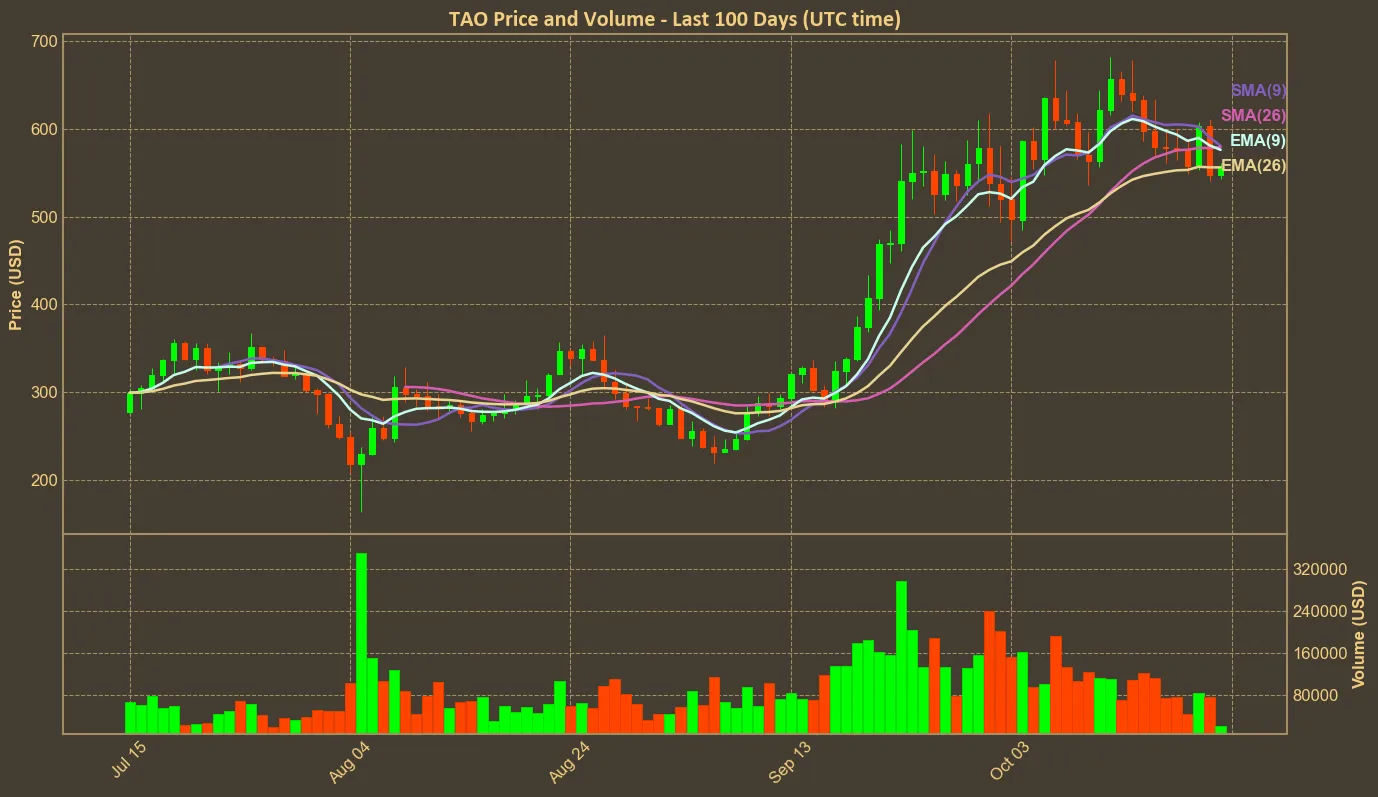
Meanwhile, the Moving Average Convergence Divergence (MACD) shows negative divergence, which can signal upcoming price corrections. Short-term moving averages such as the Simple Moving Average (SMA) and Exponential Moving Average (EMA) suggest stability despite the market’s noise. The Average True Range (ATR), reflecting market volatility, remains relatively high, hinting at the potential for substantive price shifts in the near future.

Reflections on Bittensor’s Trajectory
Bittensor has undoubtedly captured market interest with its innovative merging of blockchain technology and AI. However, several elements should be considered from an analytical perspective. The influence of major stakeholders, such as whales dominating long positions, adds a layer of complexity to its market movements. The anticipated Nvidia earnings report, which will be released on November 19, presents another intriguing variable that could impact the broader AI and cryptocurrency domains. Keeping these factors in mind, while technical analysis provides a framework for understanding market patterns, it has limitations.


