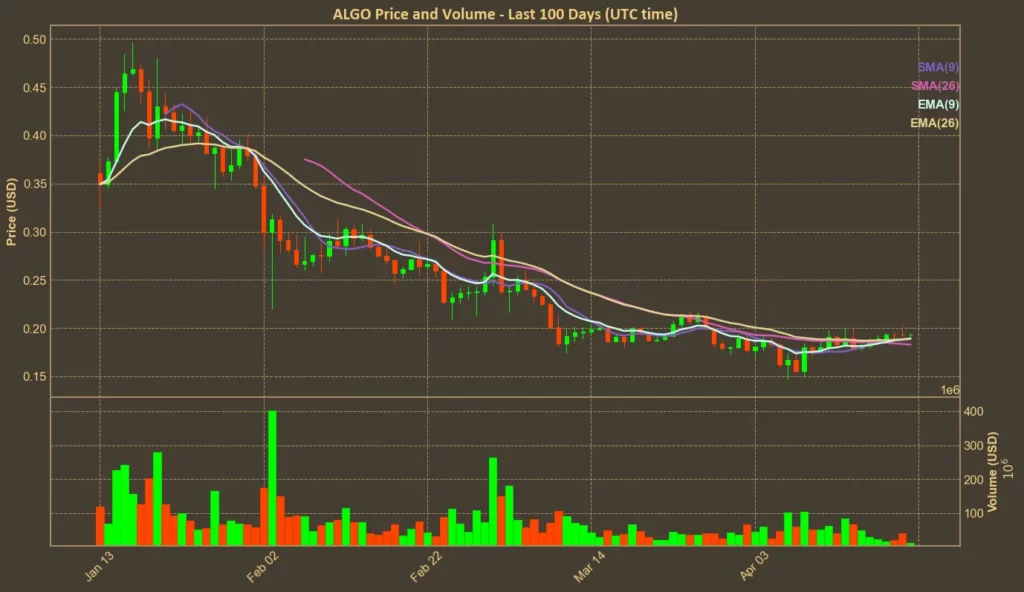
After months of underperformance, Algorand (ALGO) is showing early signs of recovery – but the signals are mixed. The price has climbed modestly over the past month, hovering around $0.19, a small uptick from its recent lows. But on a longer timeline, the coin is still far below where it stood just a quarter ago, having dropped over 50% since January. This kind of rebound might look like momentum, but it’s still far from a breakout.
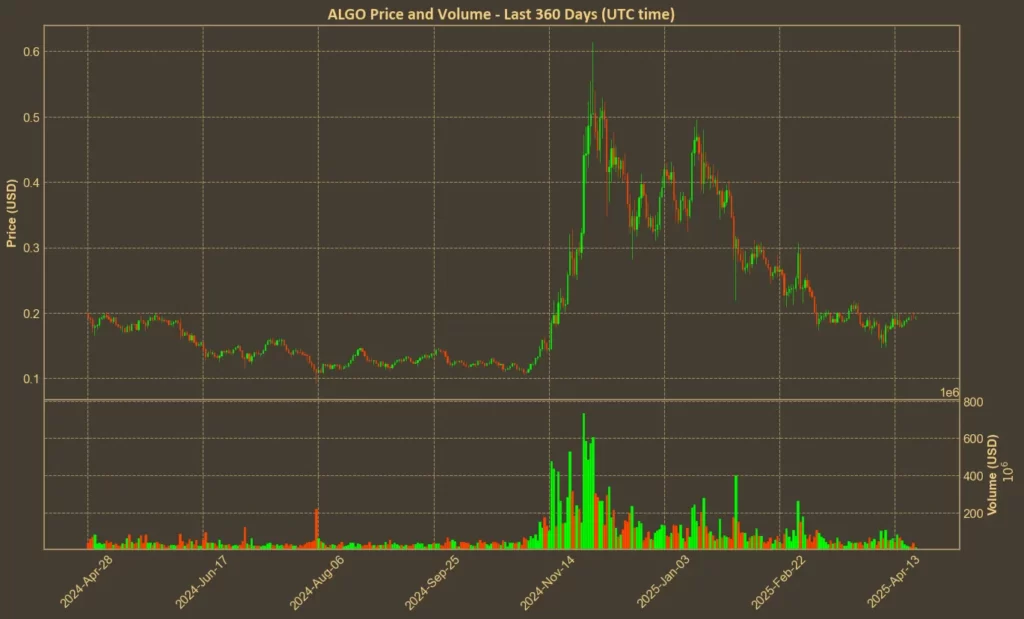
Market cap has slightly increased over the past 30 days, and trading volume has nearly doubled. That could mean growing interest, but not necessarily conviction. With small price gains, this rise in volume might reflect increased short-term trading rather than long-term holders stepping in.
Table of Contents
Click to Expand
Momentum Indicators
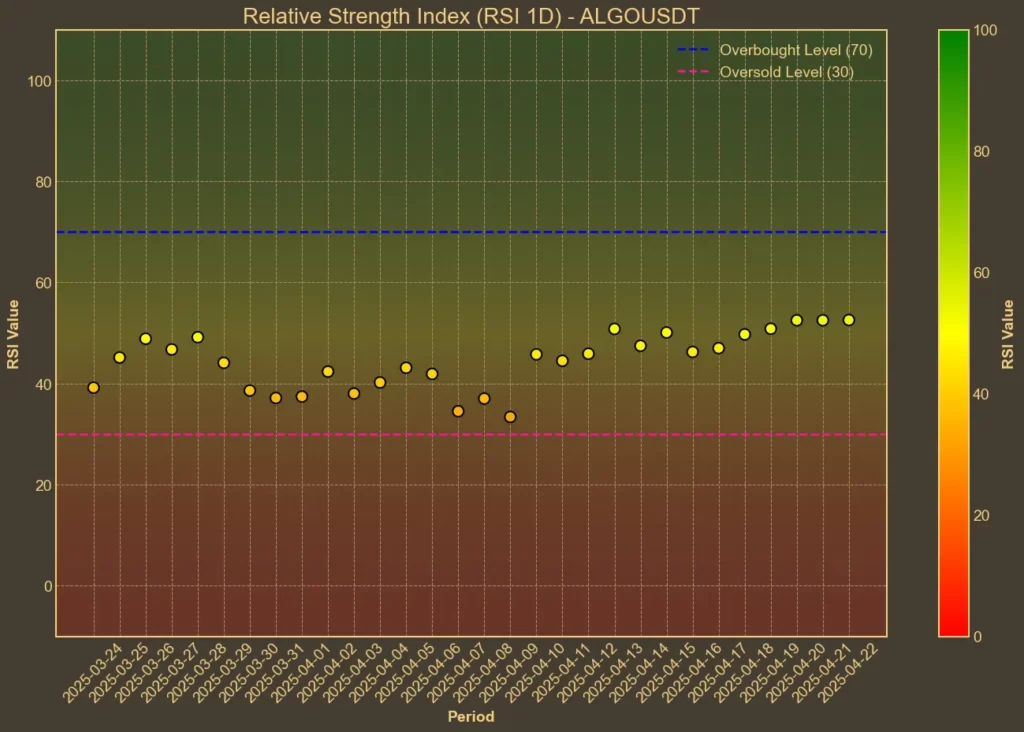
RSI: Slightly Bullish
The Relative Strength Index shows some modest strength. RSI(14) is stable at 53, suggesting the coin isn’t overbought or oversold. The shorter-term RSI(7) sits at 61, hinting at some upward pressure in the past few days. These values show positive momentum, but nothing overheated yet.
MFI: Overbought
The Money Flow Index has surged to 74, up from 49 a week ago. Since MFI also factors in volume, this jump suggests strong recent buying activity. But with the value close to overbought territory, any continued rise could face selling pressure.
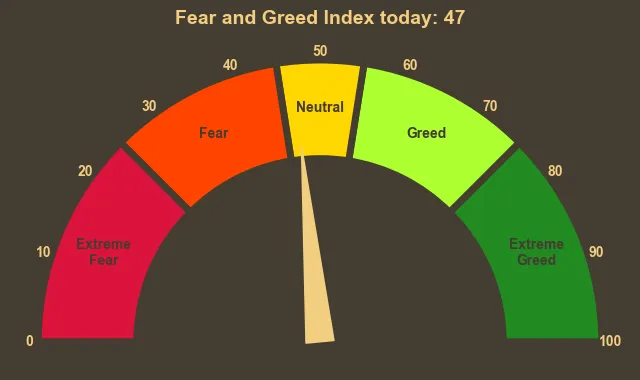
Fear & Greed Index: Neutral
The broader crypto market is in a neutral sentiment phase, with the Fear & Greed Index currently at 47. A week ago, it was at 38. That shift doesn’t say much about ALGO alone, but it does show improving risk appetite across the board, which could help support further gains.
Moving Averages
SMA & EMA: Bullish
Short-term averages are starting to favor the upside. The 9-day SMA is at 0.1887, and the EMA is slightly higher at 0.1893 – both just under the current price. The longer-term averages also reflect slow recovery. EMA(26) now matches the 9-day SMA at 0.1887, indicating some early alignment. If this trend continues, it could act as a support zone.
Bollinger Bands: Increased Volatility
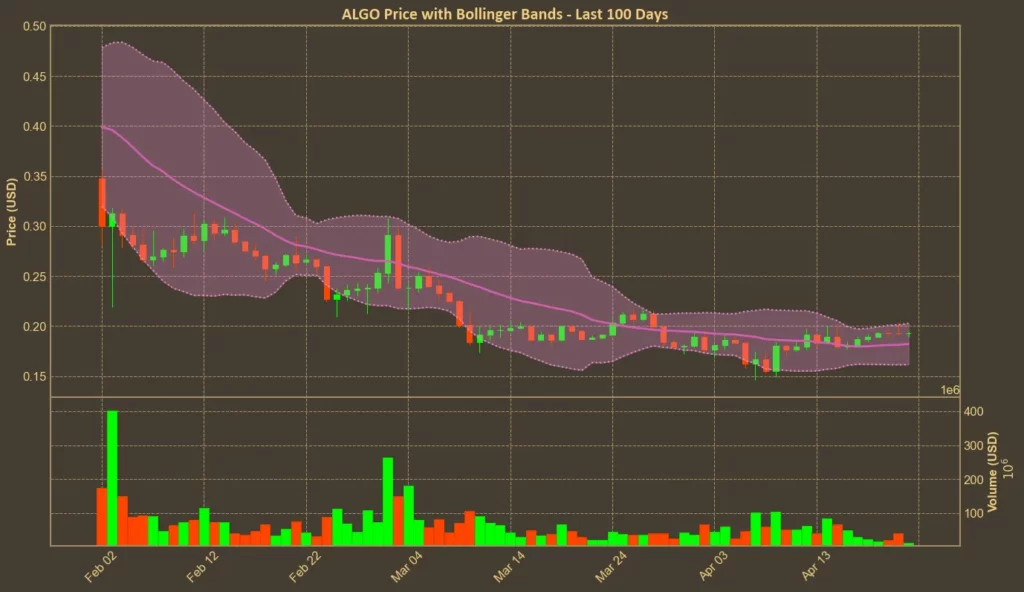
The bands have widened, and the price is currently sitting closer to the upper band at 0.2027. That suggests the coin has seen more volatility recently and could be reaching overbought levels again if the price pushes further.
Trend & Volatility Indicators
ADX: Weak Trend
ADX is stuck at 14, indicating a weak or unclear trend. This confirms what the charts suggest: ALGO is moving, but not with a lot of strength behind it.
ATR: Lower Volatility
ATR has dropped slightly to 0.014, down from 0.018 a week ago. Volatility is cooling off after recent volume spikes. Combined with a weak ADX, this might mean a pause rather than a breakout.
AO: Bullish
The Awesome Oscillator is back in the green and climbing. After spending time below zero, it’s now positive and increasing. That supports a short-term bullish case, though not strong enough to call it a confirmed trend.
VWAP: Overextended
At 0.292, the Volume-Weighted Average Price is well above the current price. This may suggest the coin is still being traded at a discount compared to recent heavy-volume transactions. If the price fails to rise toward VWAP, it could indicate hesitation or lack of commitment from bigger traders.
Relative Performance
Comparison Against Other US-Based Crypto: Outperforming
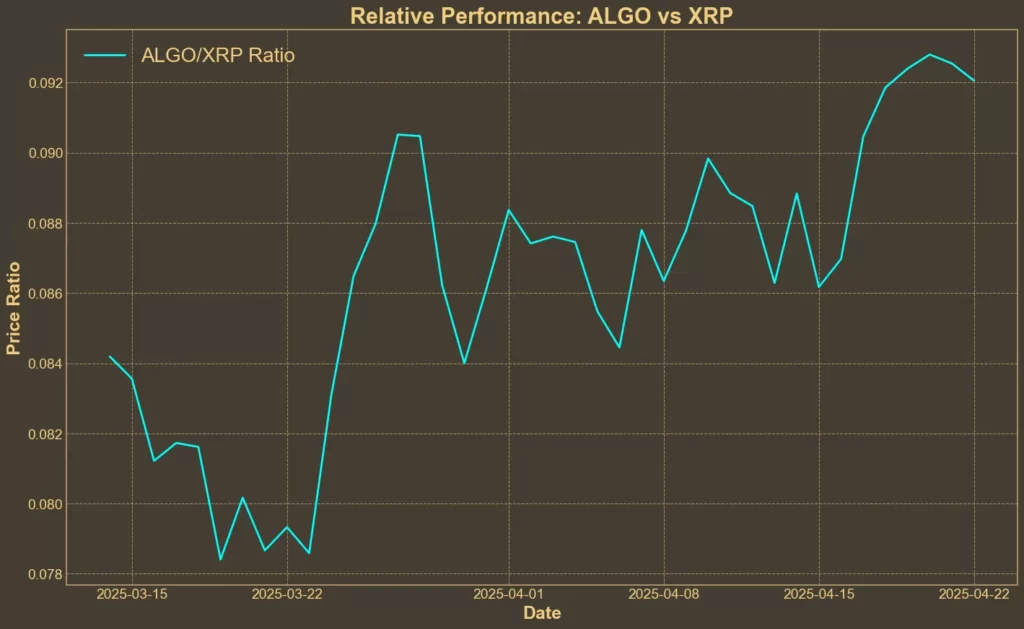
Algorand has outpaced Cardano (ADA) and Hedera (HBAR) in recent weeks, adding to its momentum against other U.S.-based blockchain projects. It has also gained steadily against XRP, with the ALGO/XRP ratio rising over 10% in the past 30 days, signaling stronger relative performance across the board.
Final Thoughts
Technically, ALGO is no longer falling. Some indicators suggest a bullish tilt, especially the AO and moving averages. But others, like MFI and ADX, show limits to the current momentum. Price action is still rangebound, and it’s not clear yet whether this is the beginning of a real trend reversal or just a bounce inside a larger downtrend.
Still, its recent outperformance against peers like XRP, Cardano, and Hedera hints that traders may be starting to rotate back into ALGO – at least for now.
Read also: Spot Crypto ETFs: Who’s Next in Line for Approval?

