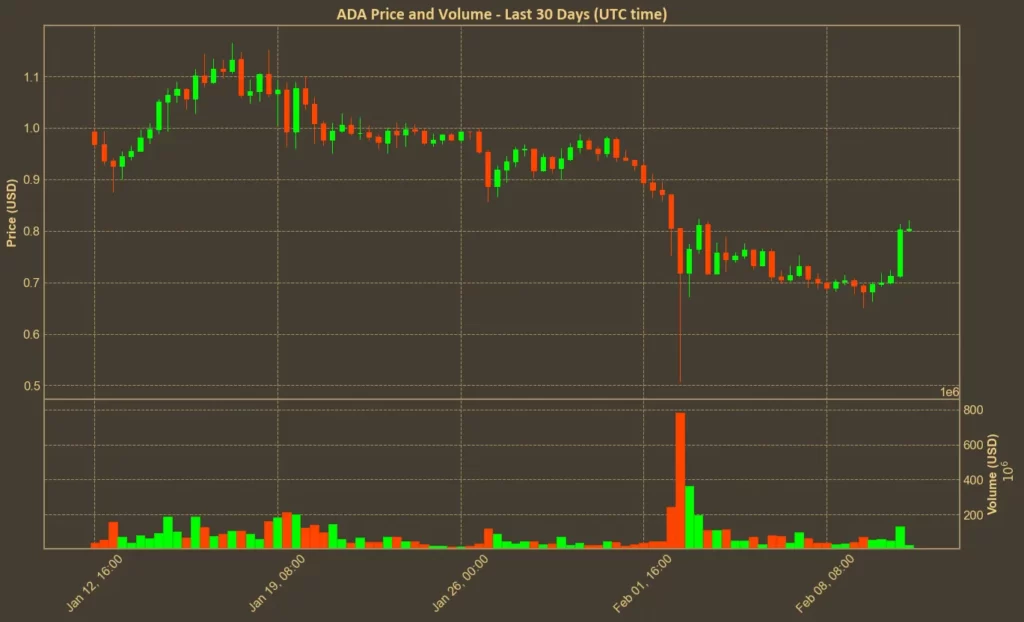
Cardano (ADA) is showing strong gains in recent days after weeks of downward pressure. The coin is currently priced at $0.80, marking a 15% increase in the last 24 hours, but still remains 19% lower than a month ago. Despite this, its quarterly performance is up over 52%, suggesting that while ADA has faced setbacks, it still holds bullish potential.

Market interest appears to be returning, as indicated by a 170% increase in trading volume over the past week. A surge in market cap of 18% over the last seven days further confirms this renewed interest. However, ADA is still far from its 2021 highs, and some investors remain skeptical about whether its recent upswing is sustainable.
Table of Contents
Momentum Indicators
RSI: Neutral to Bullish
The Relative Strength Index (RSI) helps gauge whether an asset is overbought or oversold. ADA’s RSI (14) has risen to 45 from a deeply oversold level of 29 one week ago. Short-term RSI (7) has moved from 28 to 56 in just a day, reflecting an abrupt shift in market sentiment. While ADA isn’t yet in overbought territory, this upward trend suggests improving momentum.
MFI: Weak Buying Pressure
The Money Flow Index (MFI), which accounts for both price and volume, remains low at 26. This suggests that while ADA’s price has moved up, buying pressure isn’t yet strong enough to confirm a full bullish shift.
Fear & Greed Index: Cautious Sentiment
Broad crypto market sentiment remains mixed, with the Fear & Greed Index at 47, close to neutral but still leaning toward fear. While this is an improvement from the last days, investor confidence remains fragile.
Moving Averages
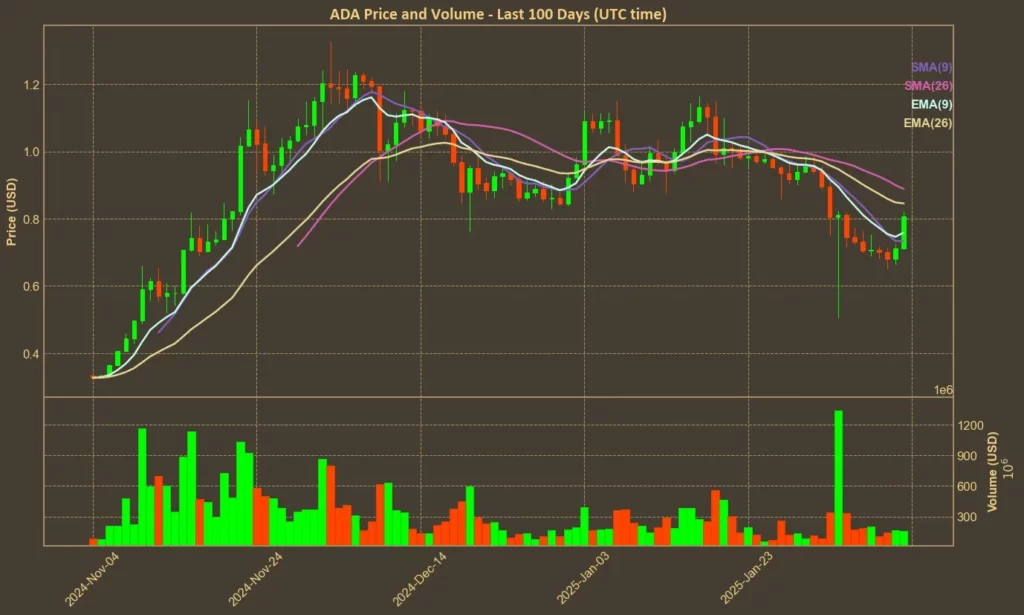
SMA & EMA: Mixed Signals
Short-term moving averages suggest ADA is attempting a rebound. The 9-day Simple Moving Average (SMA) is at $0.73, while the 9-day Exponential Moving Average (EMA) sits at $0.76, both below the current price – an encouraging sign. However, longer-term moving averages tell a different story: the 26-day SMA is still at $0.89, and the 26-day EMA is at $0.85, showing ADA is yet to break out convincingly.

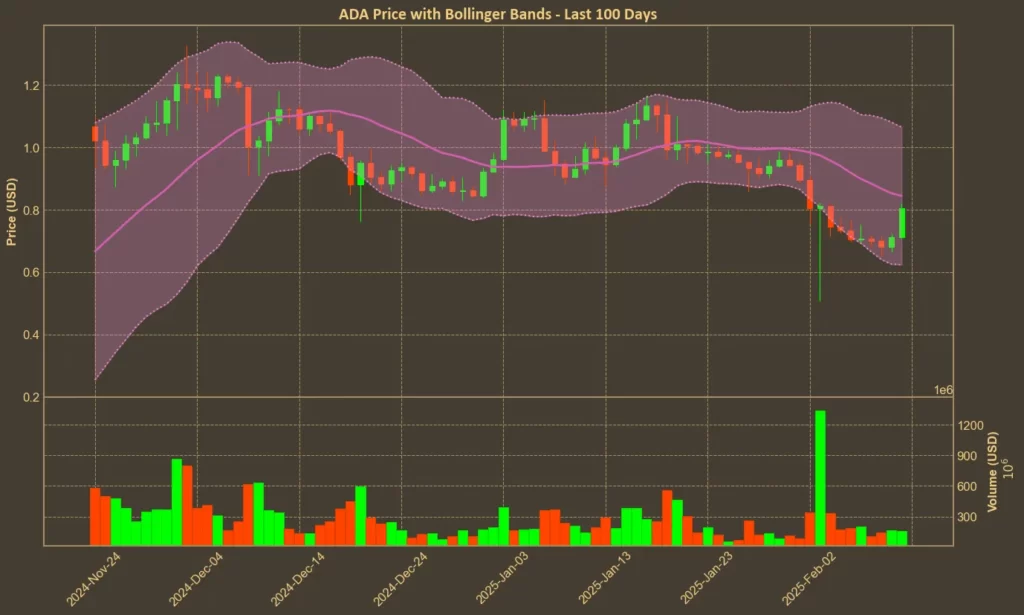
Bollinger Bands: Increased Volatility
ADA’s Bollinger Bands show the upper band at $1.06 and the lower band at $0.62, meaning price action has plenty of room to expand. With ADA currently near the middle of this range, a move toward the upper band would suggest strong bullish continuation.

Trend & Volatility Indicators
ADX: Strengthening Trend
The Average Directional Index (ADX), which measures trend strength, has jumped from 27 last week to 42 today. This confirms that ADA’s recent price movement has growing momentum.
ATR: High Volatility
The Average True Range (ATR), a measure of volatility, sits at 0.0866, up from 0.0848 yesterday. This suggests ADA’s price swings are widening, which could lead to more aggressive moves in either direction.
AO: Weak Bearish Momentum
The Awesome Oscillator (AO), which helps track momentum shifts, is currently at -0.1992, indicating lingering bearish pressure despite the recent price increase. However, it has improved from -0.2118 yesterday, suggesting a possible reversal.
VWAP: Bullish Signal
The Volume Weighted Average Price (VWAP) is at $0.9033, significantly above the current price. This is a bullish signal, showing that ADA is trading below its fair value based on volume-weighted averages.
Relative Performance
ADA vs BTC: Recovering Against Bitcoin
The ADA/BTC ratio has risen by 8.4% in the past week, though it’s still down 17.5% over the past month. This suggests ADA is slowly gaining strength against Bitcoin but has more ground to cover before confirming a sustained trend.

External Developments: ETF Speculation and Walmart Partnership
Two major developments could influence ADA’s price action. Grayscale has filed for a Cardano ETF, which, if approved, would open the door to institutional investment. Meanwhile, Walmart’s planned ADA cashback program could boost real-world adoption. While both events hold promise, they remain speculative, as the ETF faces regulatory hurdles, and the Walmart deal’s full impact is unclear.
Conclusion: A Tentative Recovery with Risks
ADA’s technical indicators suggest that while momentum is improving, caution is still advised. RSI and VWAP point toward potential upside, but weak MFI and lingering bearish AO suggest the rally isn’t fully confirmed. Moving averages show short-term strength, but longer-term levels remain a challenge.
Further ETF developments, favorable regulations, or increased adoption will accelerate gains, but technical analysis alone cannot predict these events. With key resistance levels ahead, ADA’s next move will likely depend on whether buying pressure can sustain the current momentum.
Need a quick and easy way to see what’s happening in crypto over the next few days? Check out our Crypto Events Calendar!


