Celestia (TIA) stands out as an innovative project with its unique modular blockchain approach. However, its performance over the past year has been disappointing, with the token losing over 80% of its value. This decline occurred despite significant developments in the broader crypto market, including Bitcoin’s halving and Donald Trump’s victory in the U.S. election. In fact, Celestia was among the worst-performing major tokens of 2024.
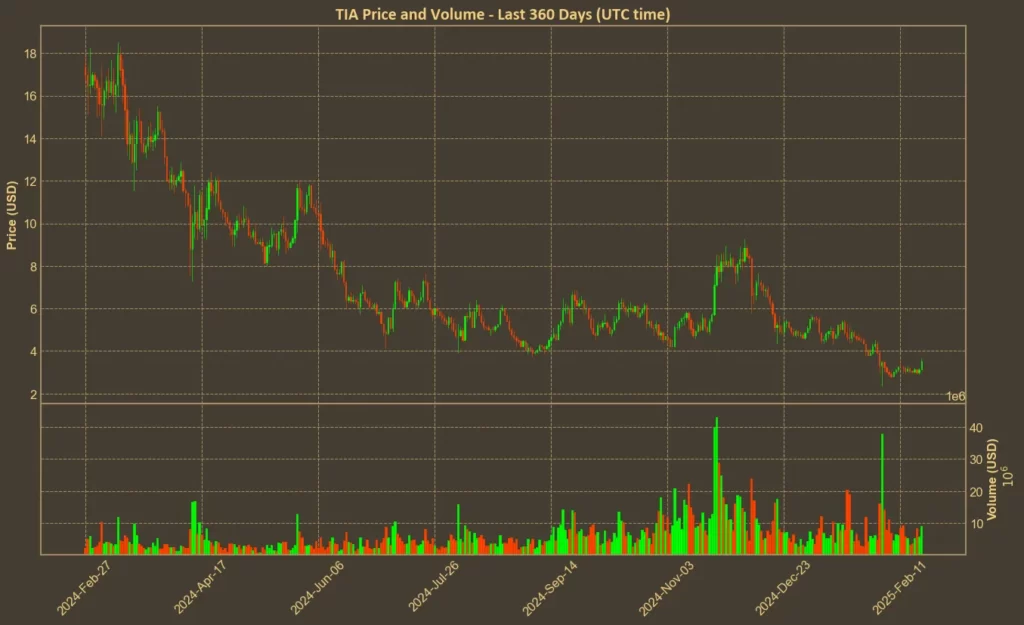
The downward trend persisted throughout the past month, with Celestia dropping more than 25%. Yet, recent price movements suggest a potential shift in investor sentiment, as TIA is currently one of the best-performing coins, surging nearly 14% today.
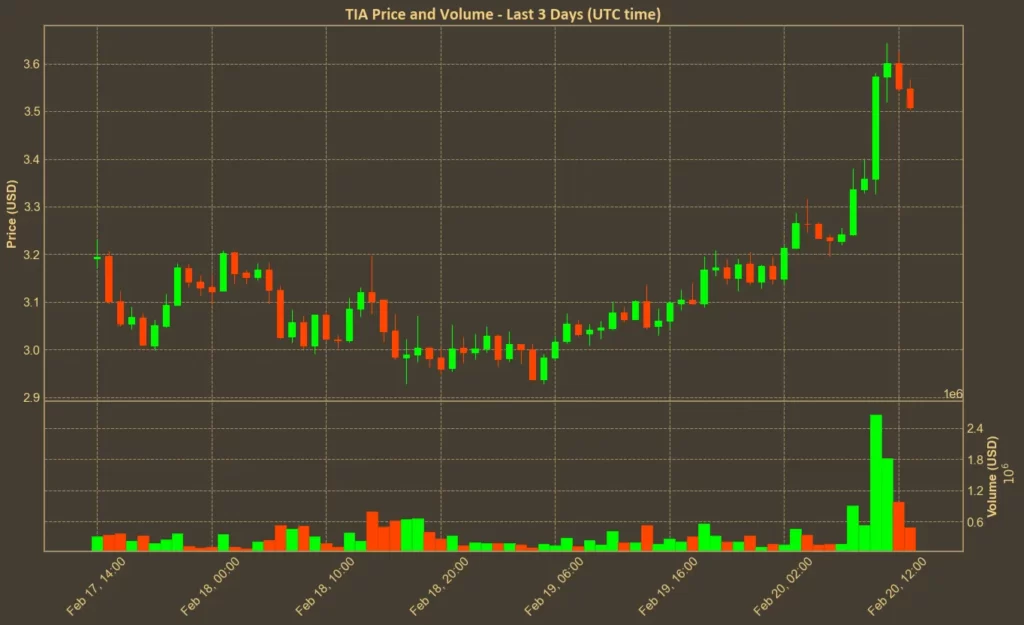
Is this the start of a sustained recovery or just a brief spike? In this article, we conduct a technical analysis to assess the coin’s momentum, volatility, and overall trend. However, it’s important to remember that technical indicators have their limitations and cannot predict unexpected market events.
Table of Contents
Momentum Indicators
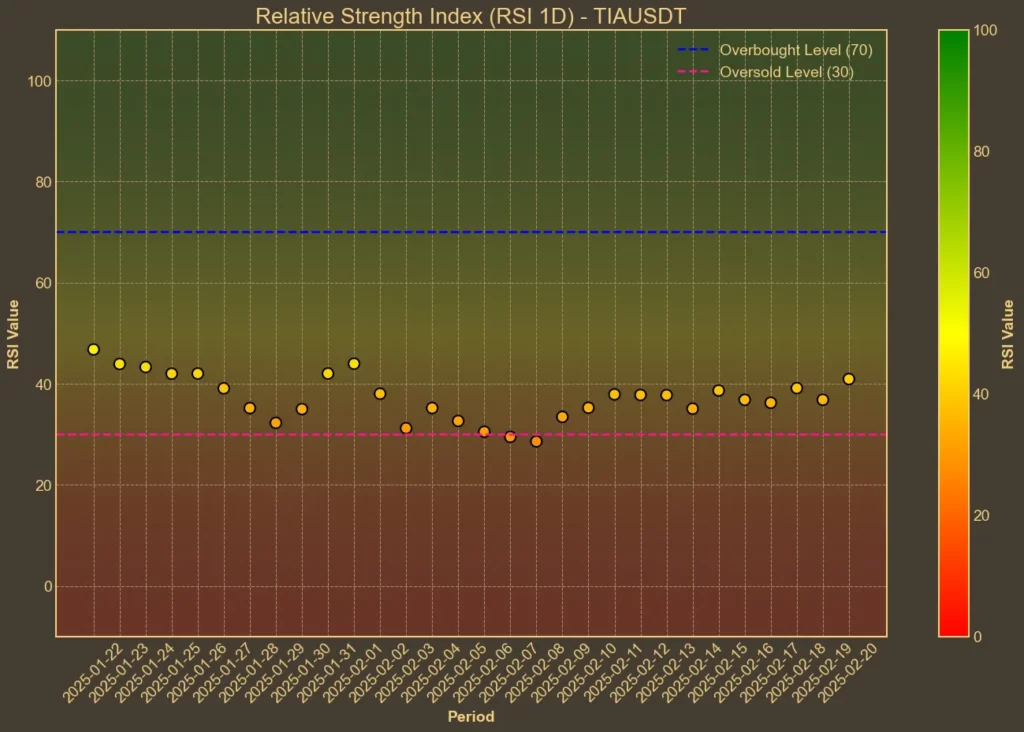
RSI: Neutral
The Relative Strength Index (RSI) measures the balance between buying and selling pressures. Currently positioned at 50 on the 14-day scale, Celestia shows neither overbought nor oversold conditions. This neutral position indicates a balanced market sentiment in the short term.
MFI: Positive
The Money Flow Index (MFI), which combines price and volume data to evaluate buying strength, stands at 59 on the 14-day scale for Celestia. This positive money flow hints at increasing investor interest and potential upward momentum.
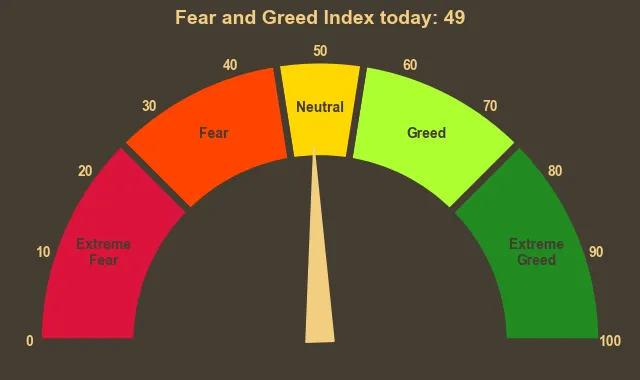
Fear & Greed Index: Neutral
The Fear & Greed Index gauges overall market sentiment, which might (but does not have to) influence Celestia. Current index value of 49 reflects a neutral stance, indicating neither fear nor greed among investors.
Moving Averages
SMA & EMA: Bearish
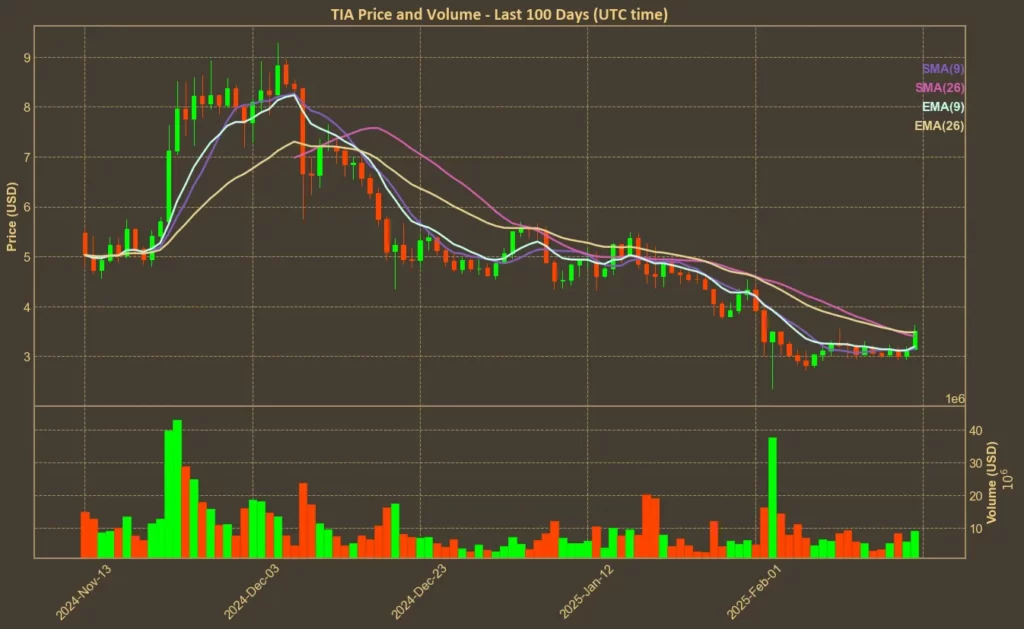
Simple Moving Averages (SMA) and Exponential Moving Averages (EMA) offer insights into price trends. Celestia’s 9-day SMA and EMA are slightly below the 26-day counterparts, pointing to a bearish trend. This pattern suggests continued downward pressure in the near term.
Bollinger Bands: Cautious
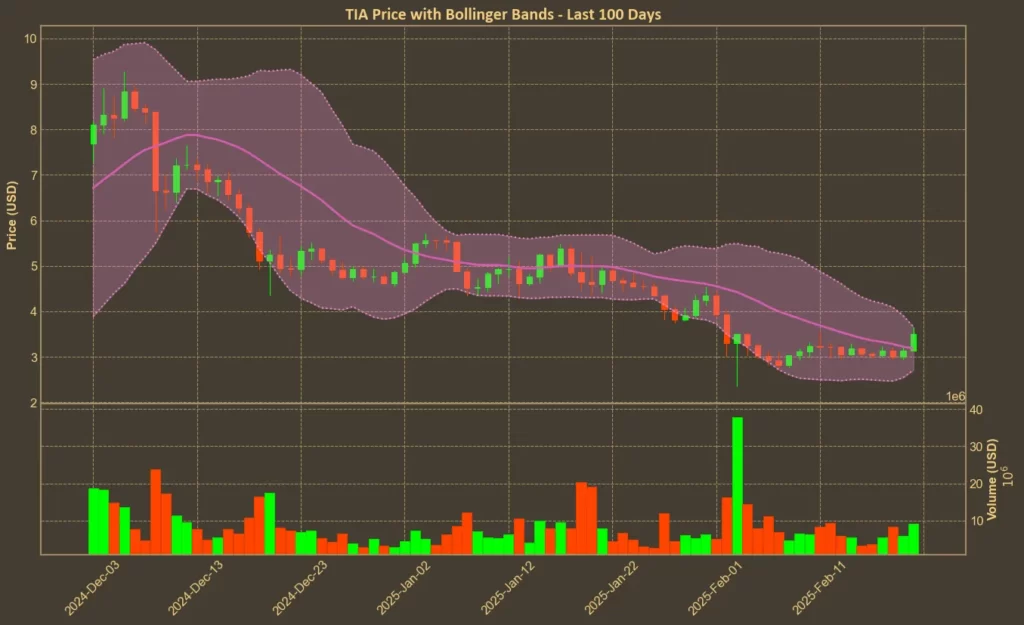
Bollinger Bands measure price volatility and potential breakout points. Celestia is currently near the lower band of 2.71, which could indicate oversold conditions. However, lingering near this band also suggests limited volatility, warranting cautious interpretation.
Trend & Volatility Indicators
ADX: Strong Trend
The Average Directional Index (ADX) assesses trend strength. With an ADX of 33, Celestia demonstrates a strong trend, indicating sustained price movement in its current direction. This trend strength may influence upcoming bullish price changes.
ATR: Little Volatility
The Average True Range (ATR) measures market volatility. Celestia’s ATR of 0.38 is relatively steady, suggesting consistent volatility levels. This stability can provide a more predictable environment for traders making strategic decisions.
AO: Improving Momentum
The Awesome Oscillator (AO) indicates trend momentum. Celestia’s AO has improved from -0.93 to -0.59, showing strengthening momentum that could pave the way for future price gains.
VWAP: Below Average
The Volume Weighted Average Price (VWAP) helps determine the average price based on trading volume. Celestia is currently below its VWAP of 5.7, which could suggest that the asset is trading at a discount relative to its volume-weighted average.
Relative Performance
Comparison Against BTC: Rising
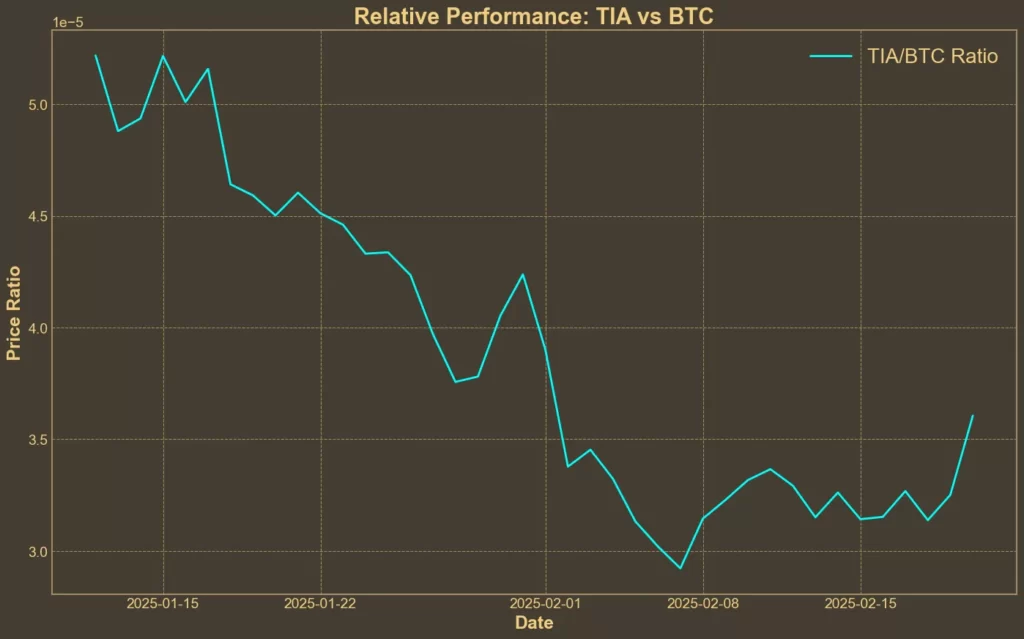
Compared to Bitcoin, Celestia’s performance shows a rising trend, with the TIA/BTC ratio increasing by approximately 14% over the past week. Despite a 20% decline over the last month, this recent upward movement hints at growing strength relative to Bitcoin.
Conclusion
In summary, Celestia’s technical indicators present a mixed but encouraging picture. While some metrics point to a bearish trend, others indicate strengthening momentum and growing relative performance against Bitcoin, especially following today’s surge. Should Celestia stabilize at its current price level, it could pave the way for continued bullish momentum.
Need a quick and easy way to see what’s happening in crypto over the next few days? Check out our Crypto Events Calendar!


