Dogwifhat has built its reputation on humor and community spirit, but its recent price action has turned serious. After months of struggle, the Solana-based token staged an impressive comeback.
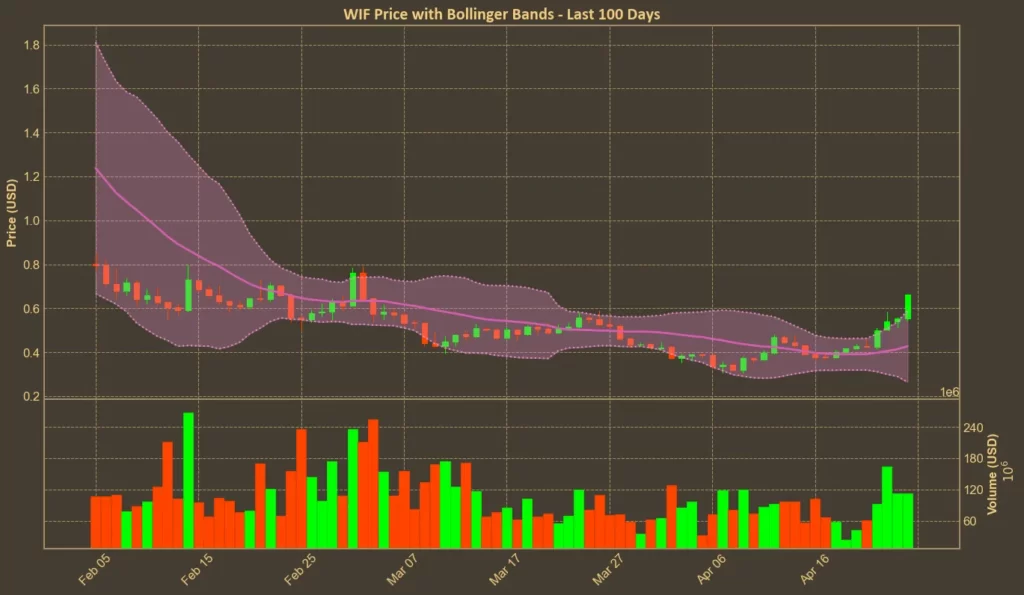
In just one week, its value surged over 60%, pushing it back into the top 100 cryptocurrencies. With daily volume reaching $250 million and market cap nearing $650 million, interest in Dogwifhat is clearly back. But technical indicators suggest that caution might be just as important as excitement right now.
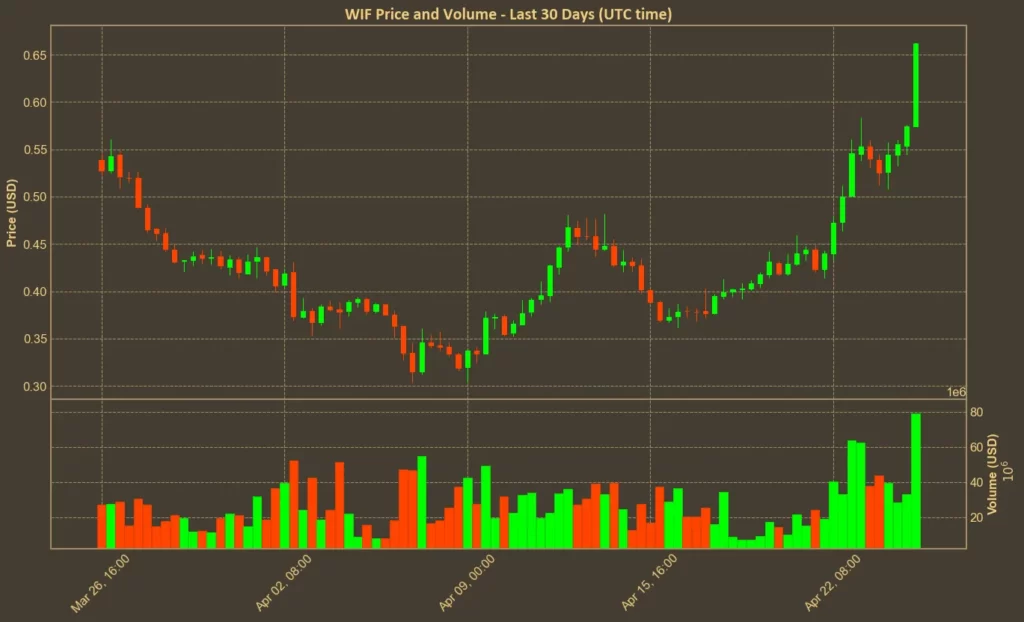
Table of Contents
Click to Expand
Momentum Indicators
RSI: Overbought
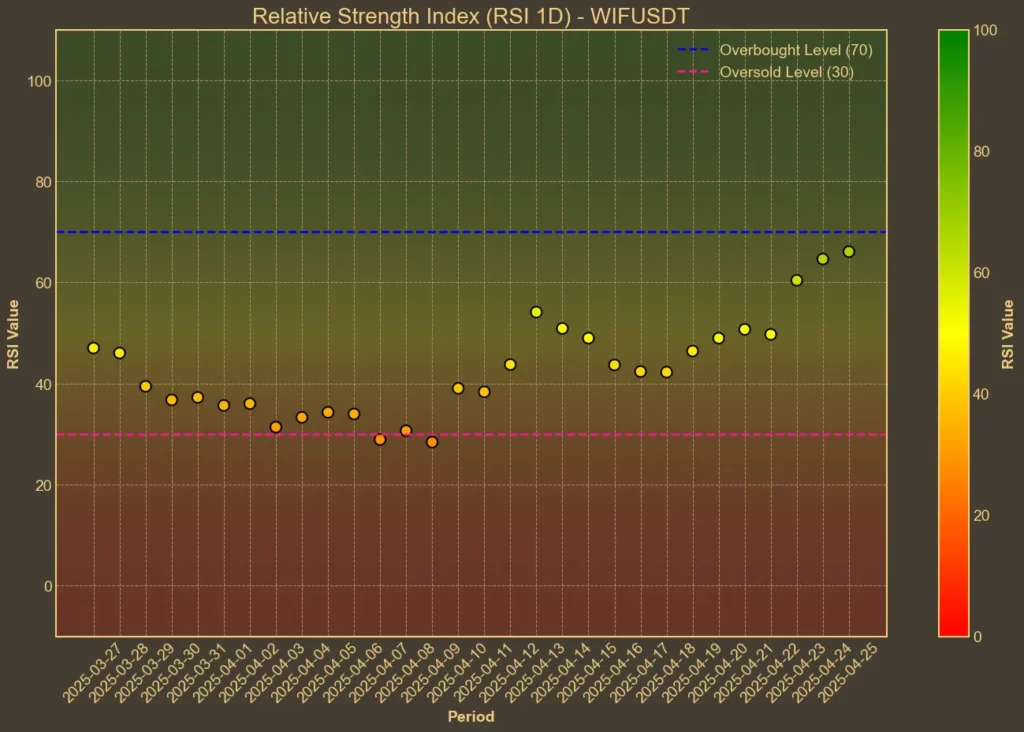
RSI, which measures whether an asset is overbought or oversold, shows a strong warning. The 14-day RSI jumped to 74, compared to 66 yesterday and 46 a week ago. The 7-day RSI, even more sensitive, is now at 88. These numbers suggest Dogwifhat is heavily overbought in the short term.
MFI: Bullish
The Money Flow Index, which combines price and volume, is also pointing upward. MFI climbed to 70 from 56 over the past week. This supports the price increase, but also hints that buying pressure could be reaching its peak.
Fear & Greed Index: Neutral
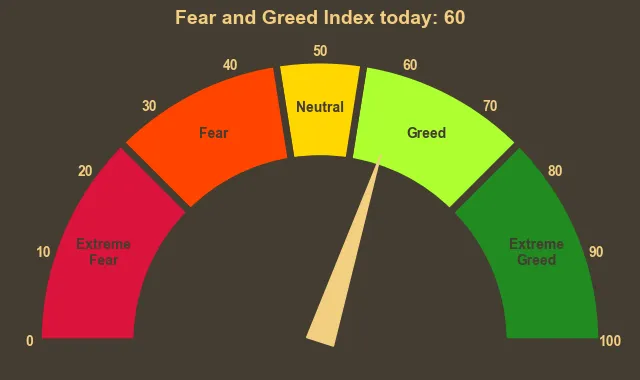
The broader market’s Fear and Greed Index sits at 60 today, down slightly from 63 yesterday. After touching 72 earlier this week, sentiment cooled off. Greed is still dominant, but it’s not extreme.
Moving Averages
SMA & EMA: Bullish
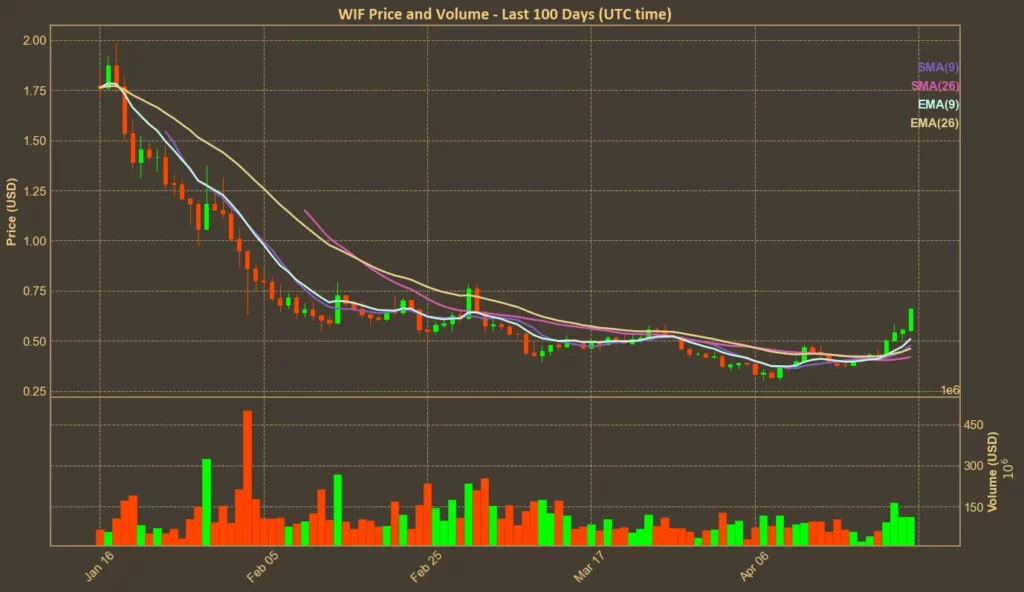
Short-term moving averages are clearly bullish. The 9-day SMA sits at $0.4778, while the EMA is slightly higher at $0.5083. Both are well below the current price, confirming positive momentum. Longer averages like the 26-day SMA and EMA are also rising, but with some lag.
Bollinger Bands: Overbought
Bollinger Bands show that Dogwifhat is trading near the upper band, currently at $0.5889. This suggests that the price is stretched, and a cooling-off period could follow.
Trend & Volatility Indicators
ADX: Strengthening Trend
The ADX measures trend strength. Rising from 21 to 24 over the past few days, it shows that the current uptrend is becoming stronger, although it is not yet in “strong trend” territory.
ATR: High Volatility
The Average True Range, which tracks volatility, rose to 0.0563 from 0.049 last week. Price swings are increasing, which could mean sharper moves both up and down.
AO: Bullish
The Awesome Oscillator flipped positive, now sitting at 0.0774. A week ago, it was still negative. This is another sign confirming upward momentum.
VWAP: Above Average
Dogwifhat’s VWAP is $0.6984, slightly above the current price. This suggests that despite the rally, buyers have not pushed it into extremely overbought territory yet from a volume-weighted perspective.
Relative Performance
Comparison Against DOGE: Outperforming
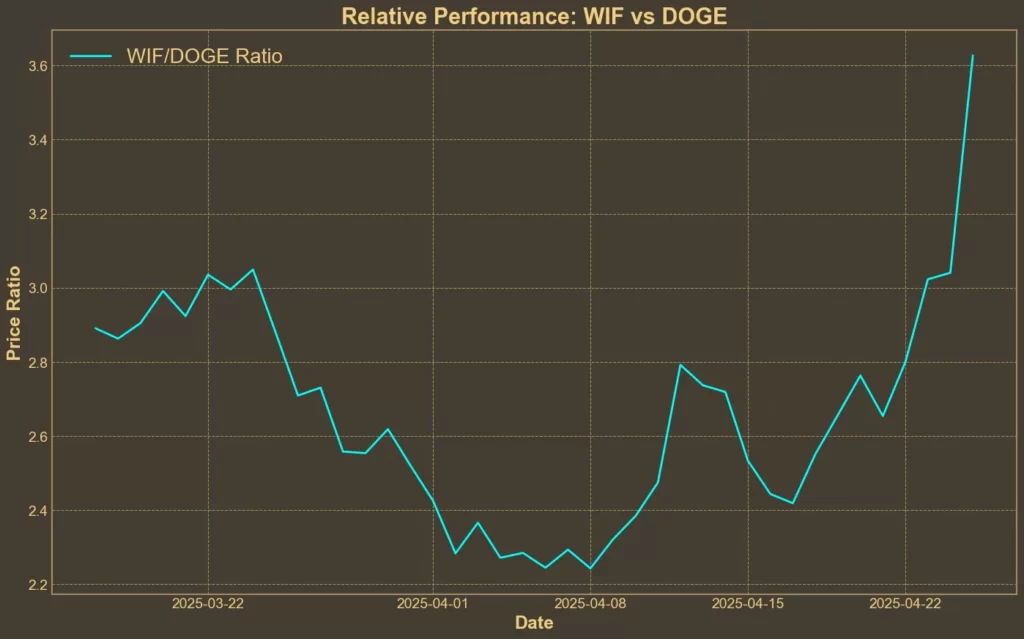
Against Dogecoin, Dogwifhat has been extremely strong. The WIF/DOGE ratio jumped by 41% in just a week. Over the past month, it climbed by nearly 32%. This rising trend shows that Dogwifhat is outperforming memecoin leader – at least in the short term.
Conclusion
Technical indicators suggest that Dogwifhat is currently in a strong uptrend, but many metrics also show that the token is entering overbought territory. The rally has strong support from volume and momentum, but such fast moves often face short-term corrections.
While the market sentiment is still generally favorable, it’s important to remember that technical analysis looks at probabilities, not guarantees. Momentum can shift quickly, especially in assets that rely heavily on community enthusiasm.
Read also: Dogwifhat (WIF) Abandons Its Plans for Las Vegas Sphere

