After a volatile month of price moves, Ethena is starting to draw more attention from analysts. ENA fell over 12% today, but zooming out, the monthly performance is still green. That kind of conflicting momentum can be confusing, especially when the indicators don’t clearly align. Ethena’s short-term price is down, but the volume surge over the last 30 days suggests something bigger might be building.
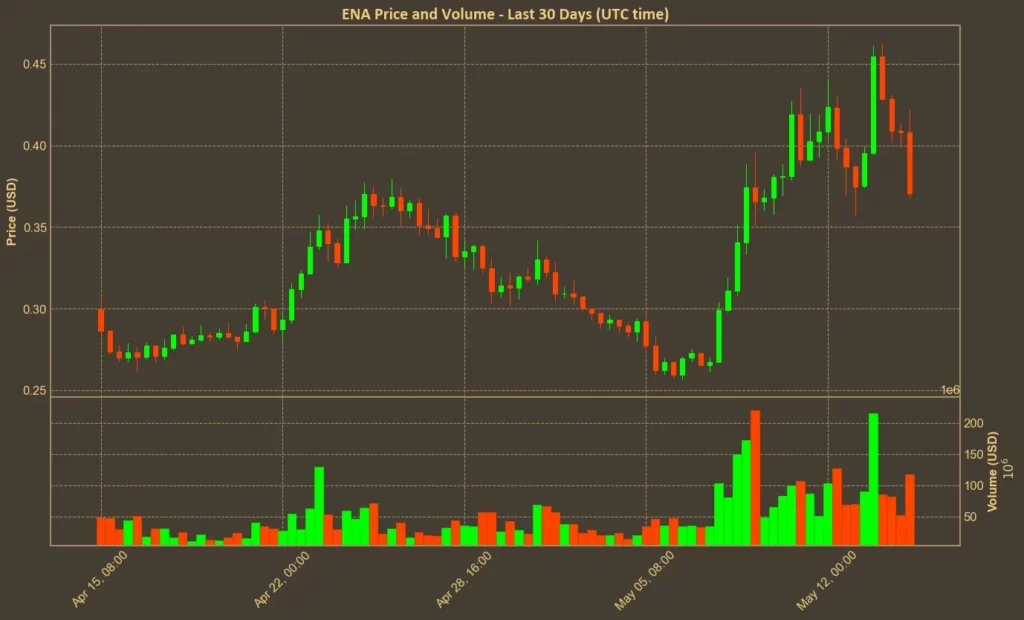
At $0.37, ENA is still well below its earlier quarter levels, down over 20% from three months ago and nearly 50% over the year. But the 22% gain in the last week suggests a recovery attempt is underway. Whether that attempt holds or fails depends heavily on how momentum, trend strength, and volatility change in the next few days.
Table of Contents
Click to Expand
Momentum Indicators
RSI: Neutral
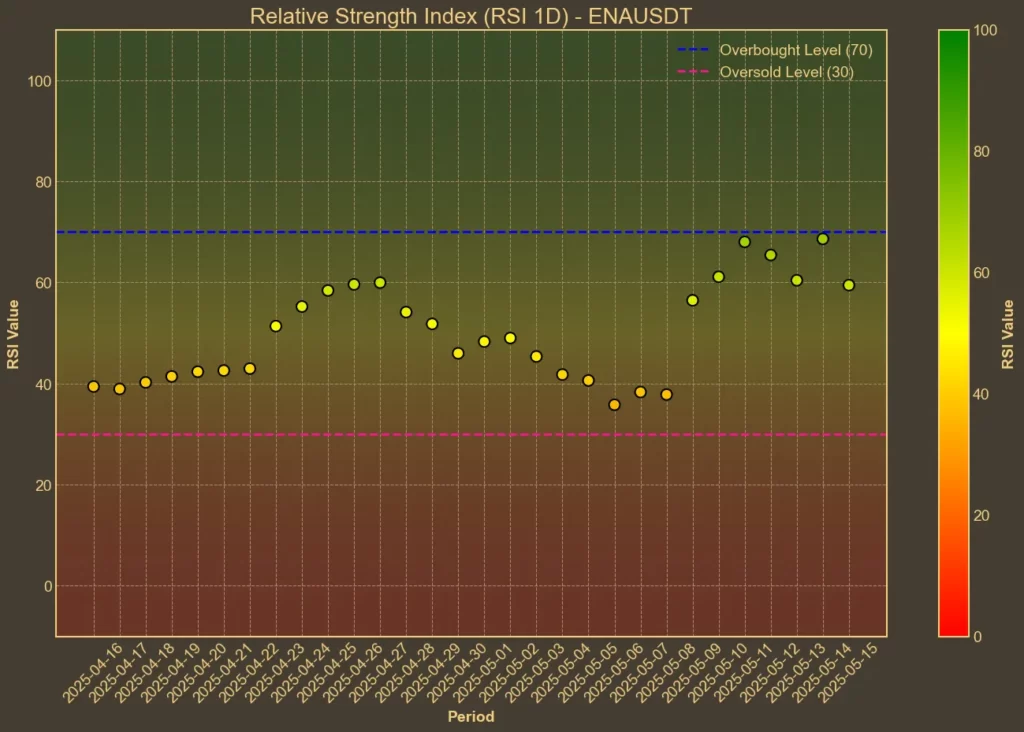
The Relative Strength Index tracks whether a coin is overbought or oversold. Today’s RSI(14) is at 53, down from 59 yesterday. RSI(7), more sensitive to short-term shifts, dropped from 60 to 51. These numbers reflect a clear loss of short-term buying pressure. But neither value shows a strong signal – there’s no clear direction, just fading enthusiasm.
MFI: Bullish
The Money Flow Index adds volume to RSI logic. MFI(14) stands at 62 today, compared to 67 yesterday and 50 a week ago. While slightly down from yesterday, it’s still well into bullish territory. This supports the idea that last week’s price climb had real backing, even if it’s paused now.
Fear & Greed Index: Greed
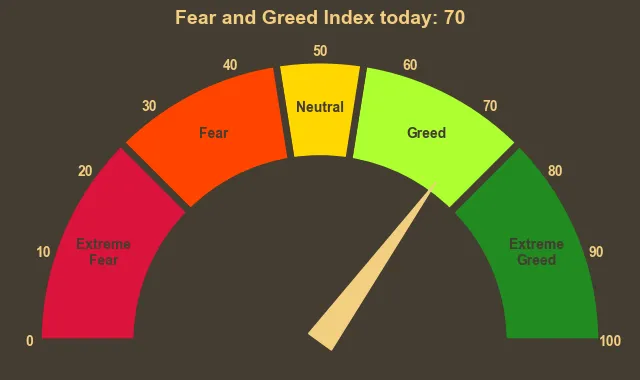
This index isn’t Ethena specific, but it hints at broader investor mood. A reading of 70 suggests greed is dominating sentiment right now. That’s been consistent all week, except for minor dips to 65. That backdrop can encourage speculation – but it also means the market could be fragile if momentum weakens.
Read also: How To Use Crypto Fear and Greed Index To Your Advantage?
Moving Averages
SMA & EMA: Short-Term Bearish
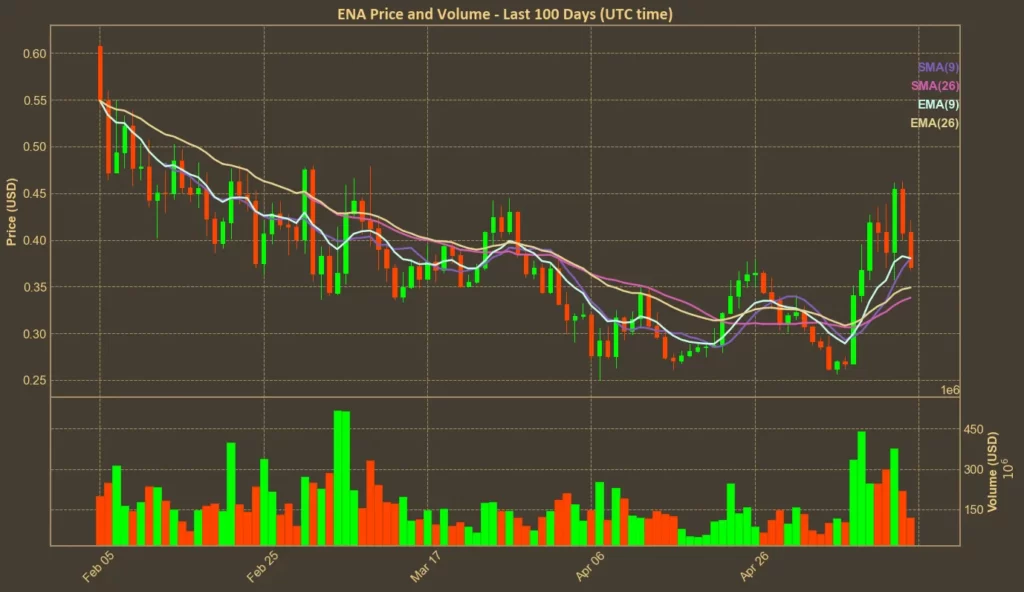
Both short-term moving averages are above today’s price. The 9-day SMA is 0.3803 and EMA is 0.3801, while ENA trades under both. That usually signals short-term pressure. The longer-term 26-day averages (SMA at 0.3381 and EMA at 0.3488) are below the price, showing some support remains. It’s a split picture, but for short-term traders the outlook is bearish.
Bollinger Bands: Increased Volatility
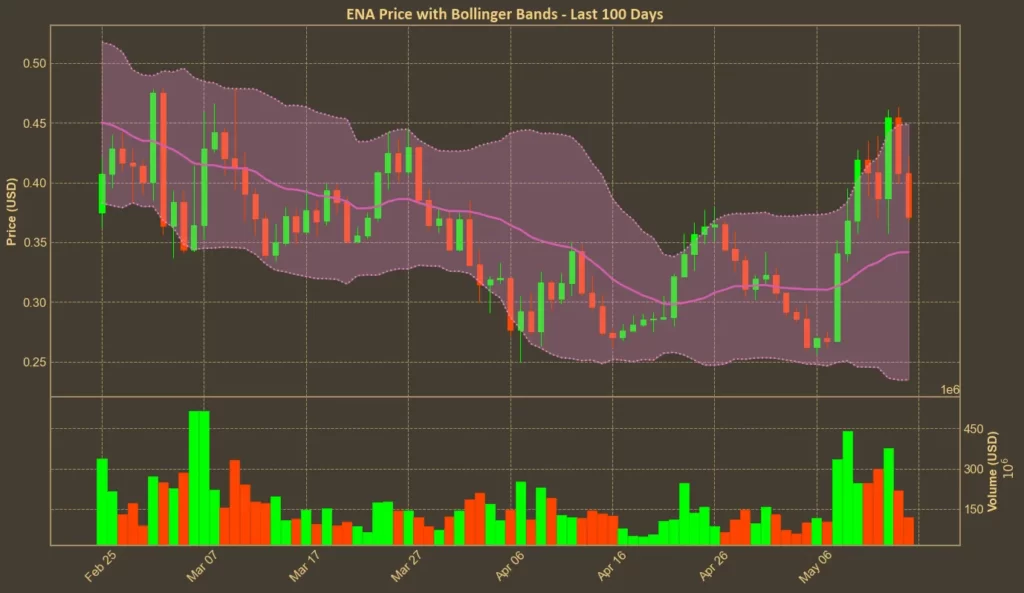
The bands have widened – upper band at 0.4489 and lower at 0.2348 – suggesting volatility is rising. Today’s price is leaning toward the middle, but closer to the lower half. This suggests that if support fails, ENA could slip further. But if the recent volume spike is real, a move toward the upper band isn’t off the table either.
Trend & Volatility Indicators
ADX: Weak Trend
At 24, the ADX suggests ENA’s trend is present but not especially strong. It’s up from last week (16), but holding steady for three days now. That supports the idea that momentum is trying to build but hasn’t locked in.
ATR: High Volatility
ATR is up to 0.046, from 0.0314 a week ago. That’s a clear volatility jump. It confirms what Bollinger Bands already show – price swings are getting wider. Traders may need to tighten stop-losses or widen targets, depending on bias.
AO: Bullish
The Awesome Oscillator is positive at 0.0825, after being negative just a week ago. This momentum flip shows the bulls have at least started pushing again. It’s one of the clearer signals pointing to short-term strength.
VWAP: Bearish
VWAP is higher than current price. ENA is trading below the 0.3855 average, which suggests short-term trades are leaning bearish, even if the broader trend isn’t broken yet.
What Could Push ENA Forward?
There’s news worth watching. Ethena’s new partnership with the TON blockchain and AAVE could bring USDe and sUSDe into new user bases. There’s also the roadmap for a real-world asset chain with Securitize, suggesting Ethena wants to be more than just a synthetic dollar platform.
That said, there’s also the regulatory headwind. Ethena pulling out of Germany after BaFin scrutiny isn’t just a compliance story – it might be a long-term weakness of the project.
Final Thoughts
The technicals don’t point to a single direction. Some indicators show signs of life – like MFI and AO – while others show hesitation or weakness, like RSI and VWAP. Overall, momentum is mixed, volatility is rising, and trend strength is still developing.
This is a coin trying to recover but lacking confirmation. Volume is up, and that could be the spark. But until ENA closes above its short-term averages, this chart leans more reactive than proactive.
As always, technical indicators are useful for short-term probabilities, not predictions. They can’t factor in sudden news, regulatory moves, or protocol-level risks.
Read also: Ethena Labs Leaves German Market Amid MiCA Compliance Pressure


