HBAR showed strong growth earlier this year, climbing above $0.35 in January. But since then, the momentum has faded. Over the past five months, the trend has been mostly down. Despite a few brief rallies, each bounce has been followed by lower highs and continued selling pressure. This week’s rebound has brought some short-term optimism – but from a technical standpoint, there’s little to suggest that the broader downtrend is over.
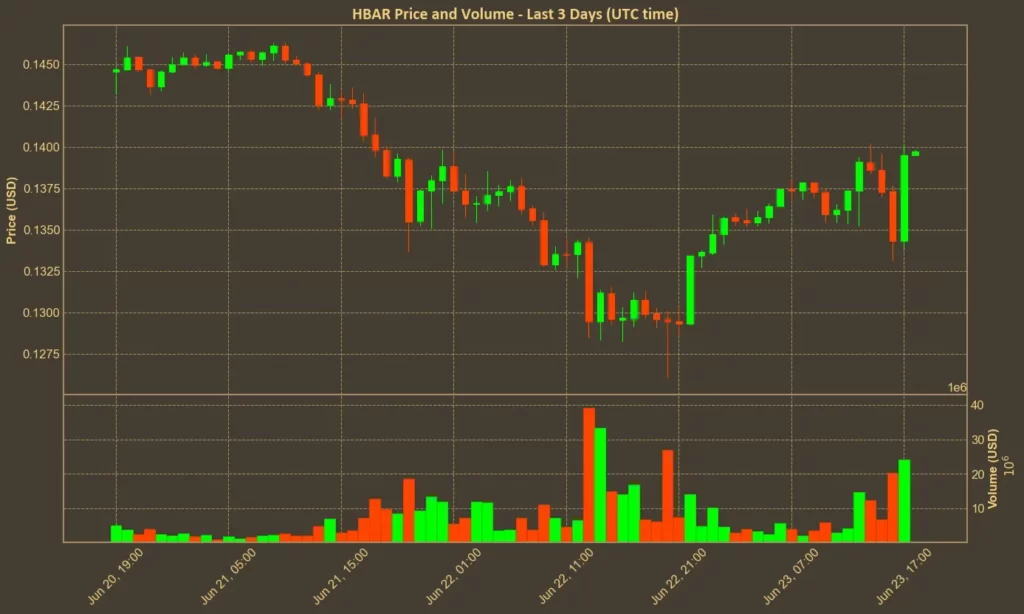
The current price around $0.14 marks a significant drop from January’s peak. Weekly and monthly indicators still point lower, and the rebound so far lacks volume support. The yearly chart shows a 79% gain, but that’s mostly a result of early 2024 action – not recent strength.
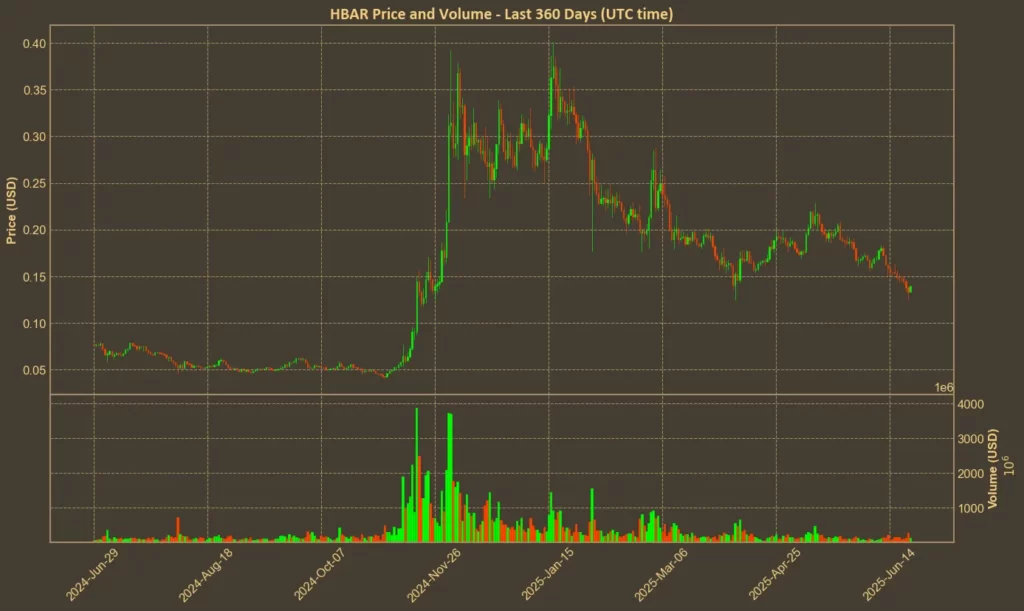
Table of Contents
Click to Expand
Momentum Indicators
RSI: Oversold
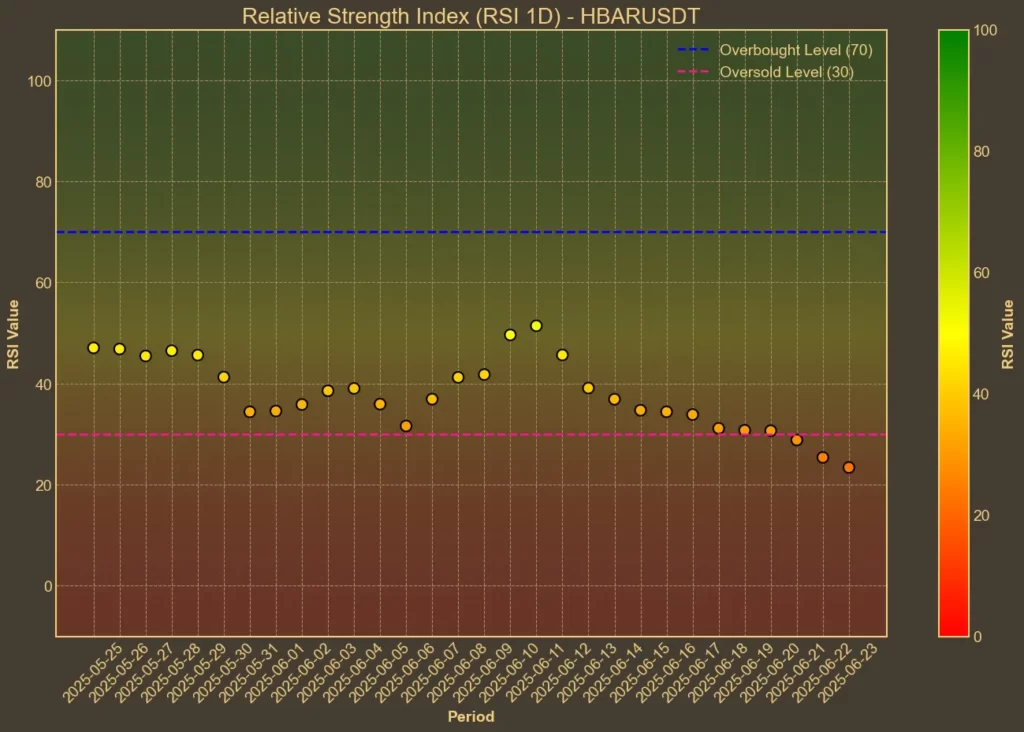
The Relative Strength Index suggests that HBAR is oversold. RSI(14) is at 31, recovering slightly from yesterday’s 23. Shorter-term RSI(7) has also moved up from 11 to 30. These numbers can indicate that selling may be slowing, but on their own, they don’t signal a reversal. The RSI has been staying low for a while, which is typical in a prolonged downtrend.
MFI: Oversold
The Money Flow Index confirms a lack of strong buying interest. MFI(14) remains at 20 and hasn’t changed in days. With values this low, accumulation still appears minimal. Even if prices bounce, moves without volume usually don’t hold.
Fear & Greed Index: Neutral
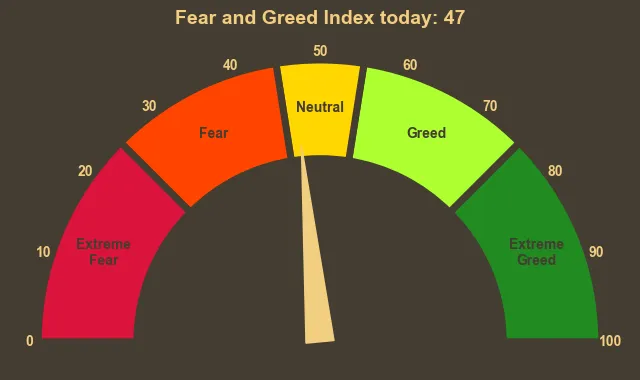
The crypto Fear and Greed Index has fallen from 68 last week to 47 today. This is not specific to HBAR, but it does show that overall market sentiment has cooled.
Moving Averages
SMA & EMA: Bearish
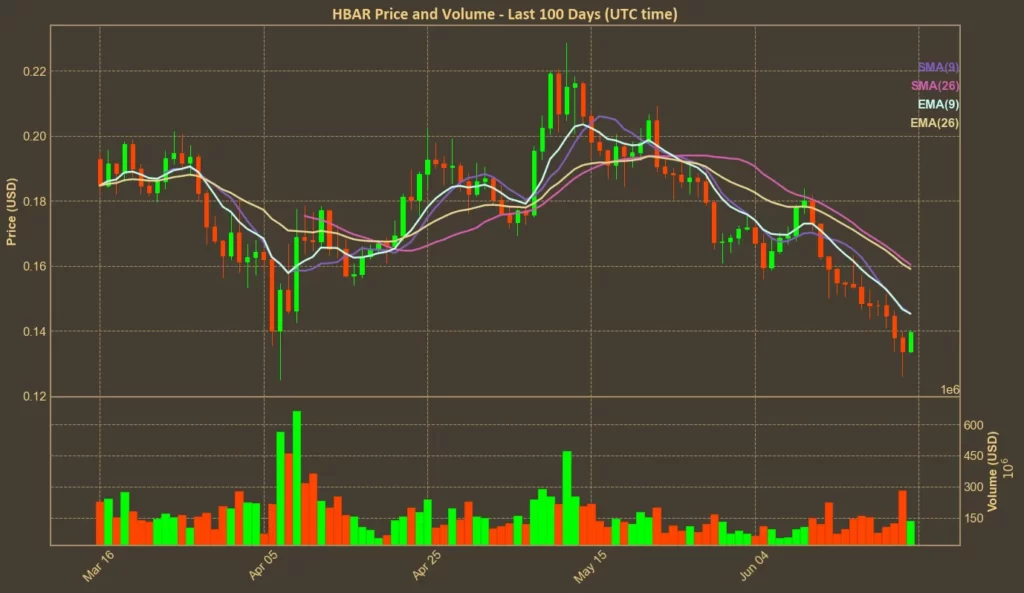
HBAR is trading below all its major short- and medium-term averages. The 9-day SMA and EMA are both at 0.1453, while the 26-day SMA and EMA sit at 0.1604 and 0.159. The price has remained under these levels for weeks, showing no real attempt to retake them. That’s a clear sign the trend hasn’t flipped.
Bollinger Bands: Volatile
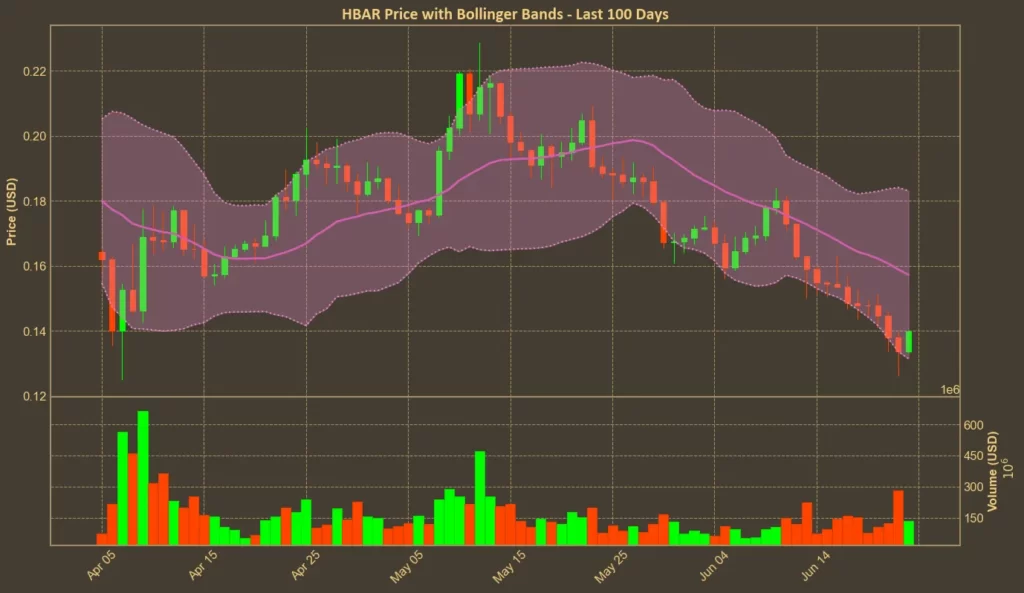
The price is near the lower end of the Bollinger Bands, currently at 0.1314. That could hint at a short-term bounce, which seems to be happening now. But the bounce is happening within a wider falling channel, not outside of it.
Trend & Volatility Indicators
ADX: Trend Still Strong
The ADX sits at 31, which indicates a strong trend. Since the direction of that trend is down, this doesn’t help the bullish case. As long as ADX stays above 25 and rising, the trend tends to continue.
ATR: Stable Volatility
The ATR is around 0.0098, similar to last week. That means price swings are wide, but haven’t grown or shrunk meaningfully. High but stable volatility typically happens in uncertain conditions – where each move up or down is questioned quickly.
AO: Bearish
The Awesome Oscillator remains well below zero and is dropping slightly. Momentum remains negative. That matches the broader trend and does not support the current price jump as a real shift in direction.
VWAP: Below Trend
HBAR is trading well below its VWAP of 0.177. This confirms that most trading over recent sessions has happened under trend-weighted levels. Buyers aren’t stepping in aggressively, and sellers still dominate recent trading windows.
Relative performance
Comparison Against BTC: Underperforming
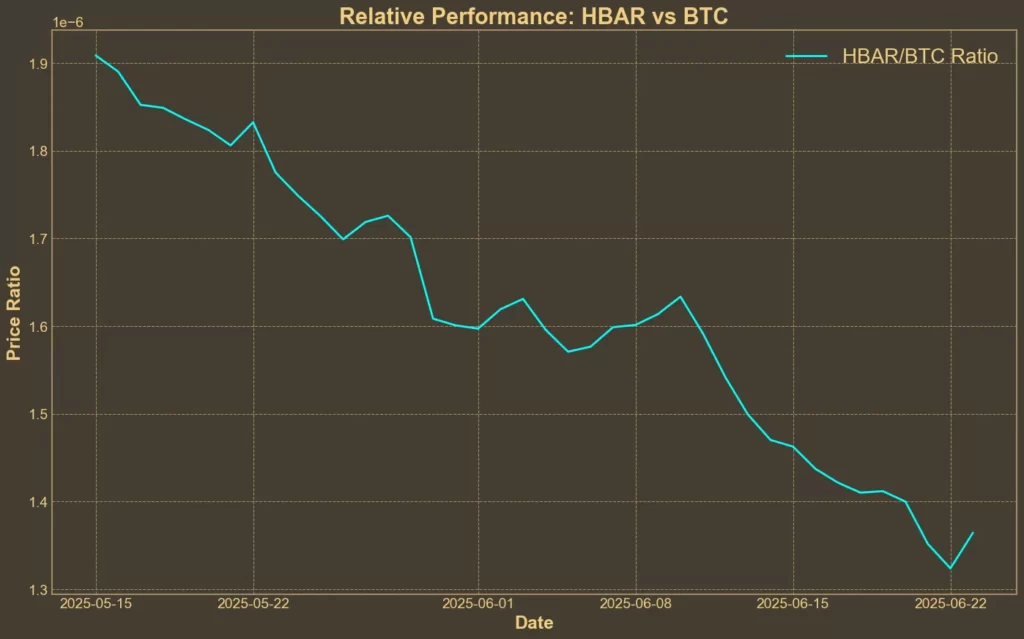
The HBAR/BTC ratio has dropped over 20% in the past month and more than 5% this week. Traders appear to be moving away from HBAR, relative to Bitcoin. A coin that underperforms both the market and its Bitcoin pair is usually not the place money flows to during market uncertainty.
Summary
The past week has brought a short-term bounce, but the bigger picture hasn’t changed. HBAR has been sliding since January, and most indicators say the downtrend is still in place.
Price is below all major averages, momentum is negative, and there’s little sign of accumulation. Today’s green candle might feel encouraging, but until the chart structure improves, it’s too early to talk about recovery.

