Chainlink (LINK) has been the focus of much attention, given its critical role in the blockchain ecosystem. The recent data and technical indicators present an intriguing picture for both short-term and long-term investors. Currently priced at $10.4, Chainlink has seen a variety of fluctuations that reflect broader market behaviors.

Recent Price Movement Analysis
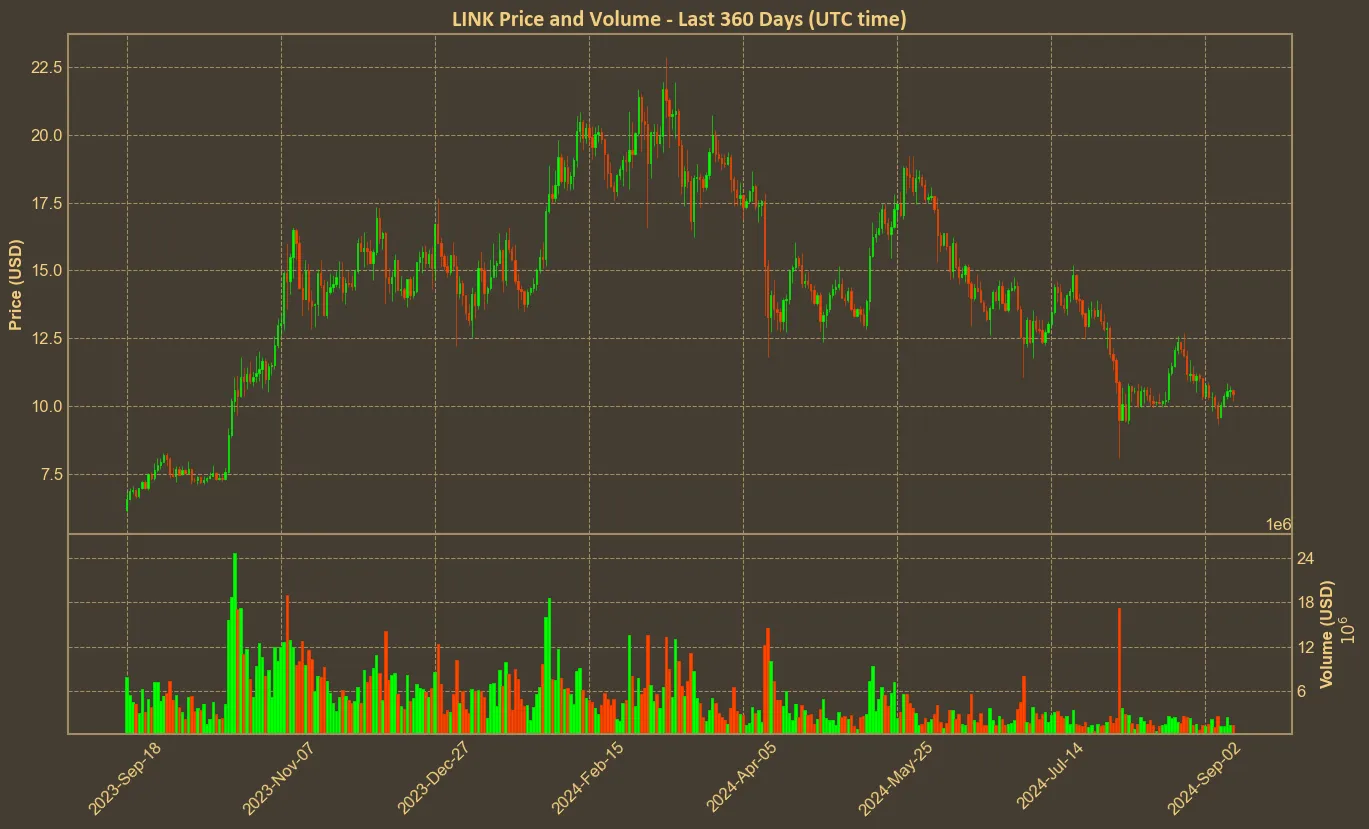
When examining the price movements over various timeframes, it’s evident that Chainlink has faced some headwinds. In the last quarter, the coin experienced a significant 32% decrease. It is also over 50% down from March tops. However, over the past year, it recorded a notable gain of 75%. Short-term metrics, such as the daily and weekly changes at -1.4% and 0.4% respectively, suggest a relatively stable yet cautious trading environment.
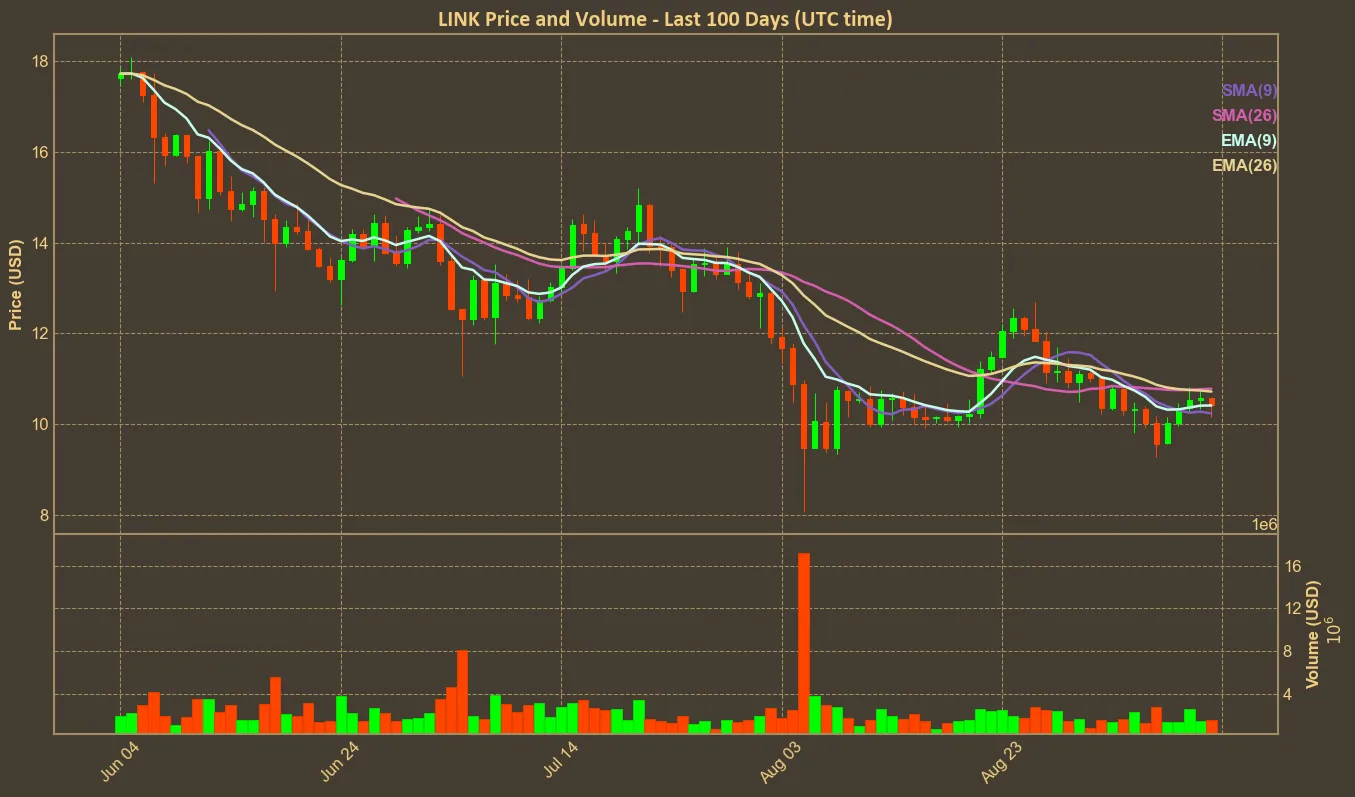
A deeper dive into the technical indicators illustrates a consolidating pattern. The Simple Moving Average (SMA) and Exponential Moving Average (EMA) have shown little deviation, indicating a period of low volatility.

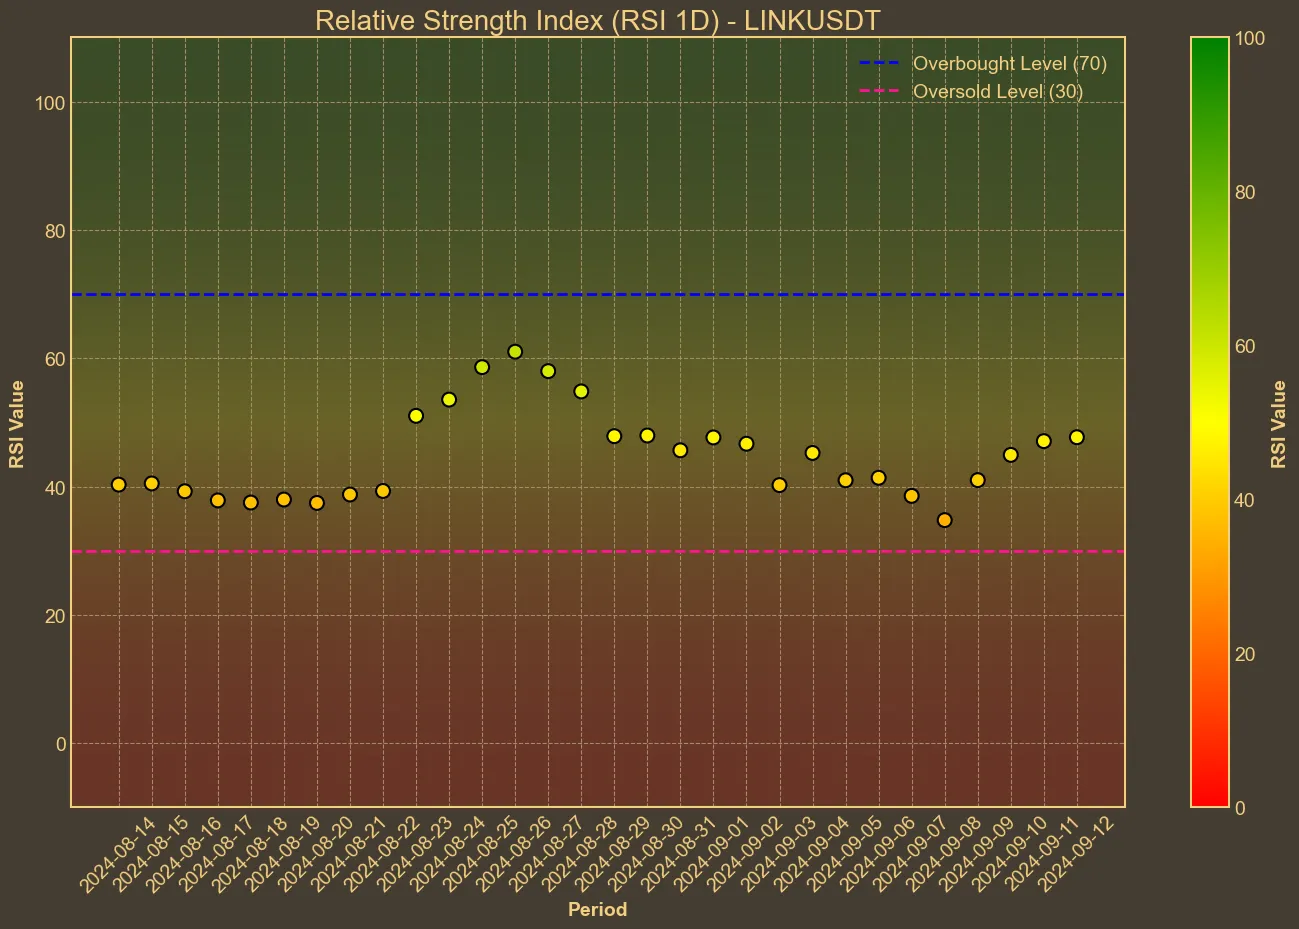
Additionally, the Relative Strength Index (RSI) hovering around 46 suggests that the market is neither overbought nor oversold. Such a position typically sets the stage for potential market movements, but lacks a clear directional bias.

Market Sentiment and Social Signals
Beyond the numbers, Chainlink’s social dominance has seen a spike, triggering discussions about a potential price rebound. Social sentiment can often serve as a precursor to market movements, aligning with the technical indicators that are currently showing signs of stabilization. The Awesome Oscillator (AO), which has shifted from -0.2 to -0.39 over a week, further reinforces the notion of a market pause.
However, the current data on market cap and trading volume changes in recent days indicate a wary investor sentiment. While the market cap grew by 1.60% in the past day, it remains quite stable over the week, suggesting a wait-and-see approach from investors. Conversely, the trading volume’s sharp decline over the last week points to reduced trading activity, which could either signify consolidation or a lack of strong market catalysts.
Conclusion
In summary, Chainlink stands at a crucial juncture with mixed signals from both social sentiment and technical indicators. While the RSI and moving averages hint at a stable, if not stagnant, phase, the social media buzz and recent market cap growth could suggest that a significant price movement is on the horizon. Despite this, investors should remain vigilant and consider the limitations of technical analysis, as it doesn’t always account for sudden market shifts or external factors influencing the blockchain space.


