After a brief moment of stability, JasmyCoin has once again extended its decline. The token is now down more than 40% in the last month, with the price sitting at $0.012. Sellers have broken through support after support, and each recovery attempt has been short-lived. Despite some intraday rebounds, JasmyCoin remains stuck in a long-term downtrend, and recent data shows that pressure hasn’t eased.
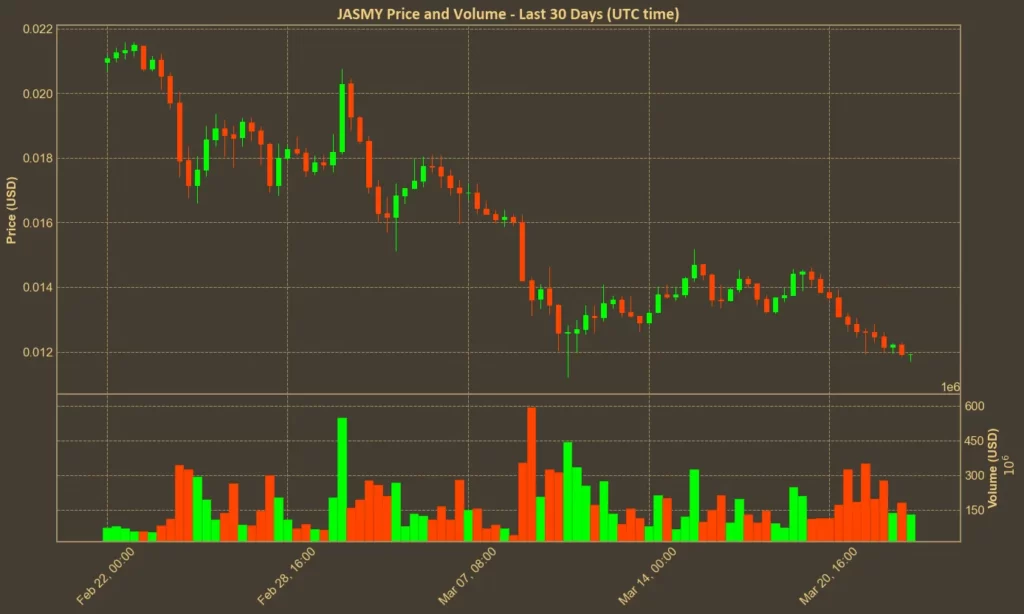
The past week reflected this clearly. A temporary bounce above $0.014 gave bulls some hope, but the move was quickly rejected. As volume spiked, it became clear that this wasn’t accumulation – it was distribution. By the end of the week, the token fell through multiple support zones, triggering stop losses and accelerating the move downward. The key $0.012 level now acts as the last meaningful psychological barrier.
Let’s look at the technical picture to see if any signs of reversal are emerging.
Table of Contents
Momentum Indicators
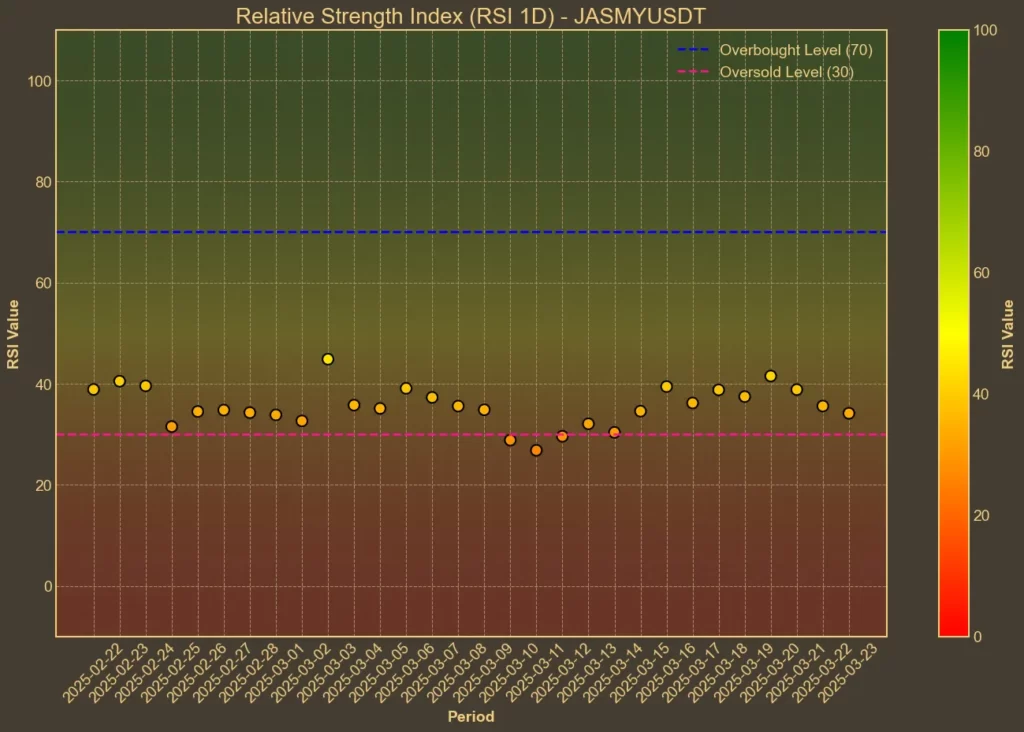
RSI: Oversold
The RSI is slipping deeper into bearish territory. With a 14-day RSI now at 33, JasmyCoin is nearing oversold conditions, but the pace of decline shows no divergence yet. The short-term RSI(7) reading of 30 reflects heavy selling pressure.
MFI: Oversold
The MFI, which also accounts for volume, is showing a minor improvement. At 34 today compared to 23 just a week ago, money flow is recovering slightly. It’s not enough to indicate a reversal, but it could mean the worst of the panic selling is over – at least temporarily.
Fear & Greed Index: Fear
The overall market sentiment is clearly in fear territory, with the index sitting at 30. Despite a spike to 49 three days ago, it quickly reverted back down, reflecting fragile confidence across the market.
Read also: How To Use Crypto Fear and Greed Index To Your Advantage?
Moving Averages
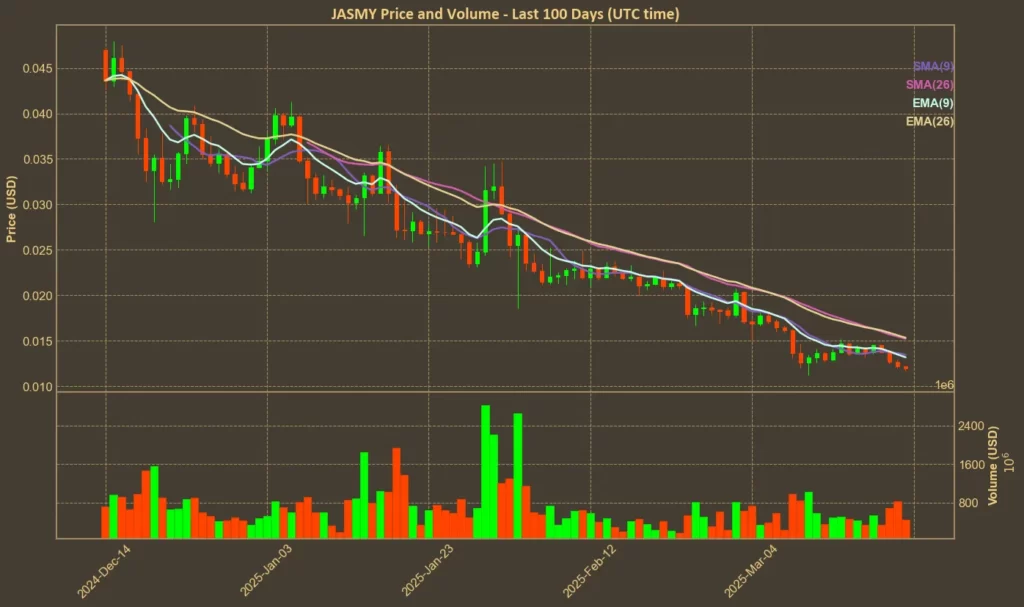
SMA & EMA: Bearish
JasmyCoin is well below both short and long-term averages. The SMA(9) at 0.0134 and EMA(9) at 0.0132 are declining, and the wider trend is confirmed by the SMA(26) at 0.0152 and EMA(26) at 0.0153. These figures show the downtrend is not only intact, but accelerating. The “death cross” setup, which started in January, remains in play.
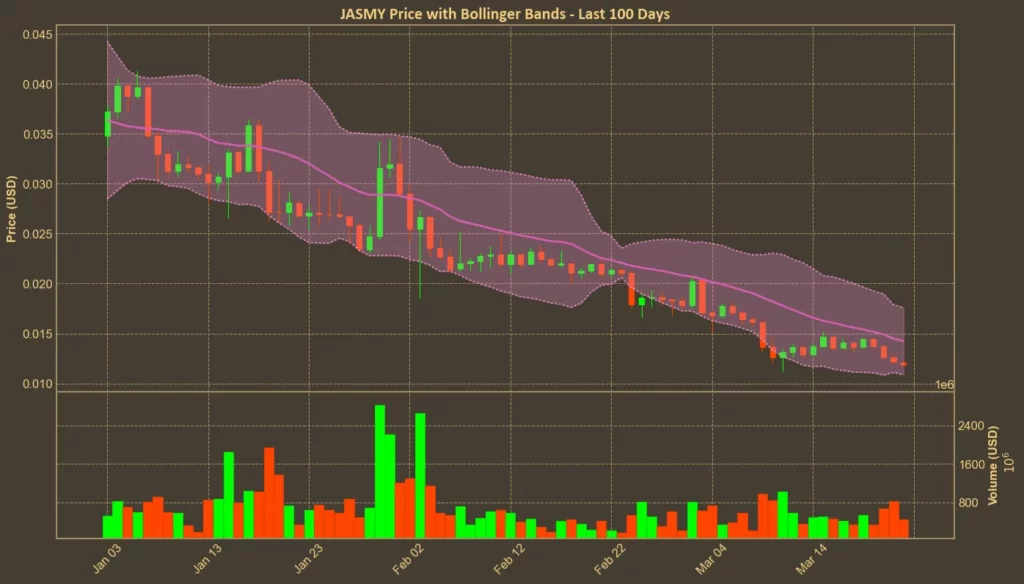
Bollinger Bands: Oversold
The price is hovering near the lower Bollinger Band at 0.0109. This suggests that JasmyCoin is trading in oversold territory, but without a clear bounce, it doesn’t imply a reversal. Volatility is rising, but it’s all coming from downside action, not a breakout.
Trend & Volatility Indicators
ADX: Stable Downtrend
The ADX at 30 confirms the strength of the current trend. There is no evidence that the downtrend is weakening, but it’s also not gaining more power. This steady trend reflects systematic selling rather than chaotic panic.
ATR: Stable Volatility
The ATR remains flat at 0.0016, showing that while volatility is elevated, it hasn’t spiked. This again points to controlled selling rather than disorderly liquidation.
AO: Bearish Momentum
The Awesome Oscillator remains deep in red. While there’s a small tick upward from -0.0047 to -0.0034, momentum is still negative. The histogram hasn’t flipped, which means bearish momentum remains dominant.
VWAP: Bearish
The VWAP sits far above at 0.0274 – more than double the current price. That distance highlights how far JasmyCoin has fallen from its average volume-weighted trading level, reinforcing the fact that it’s now deep in undervalued territory from a short-term trading perspective.
Relative Performance
Comparison Against BTC: Weak
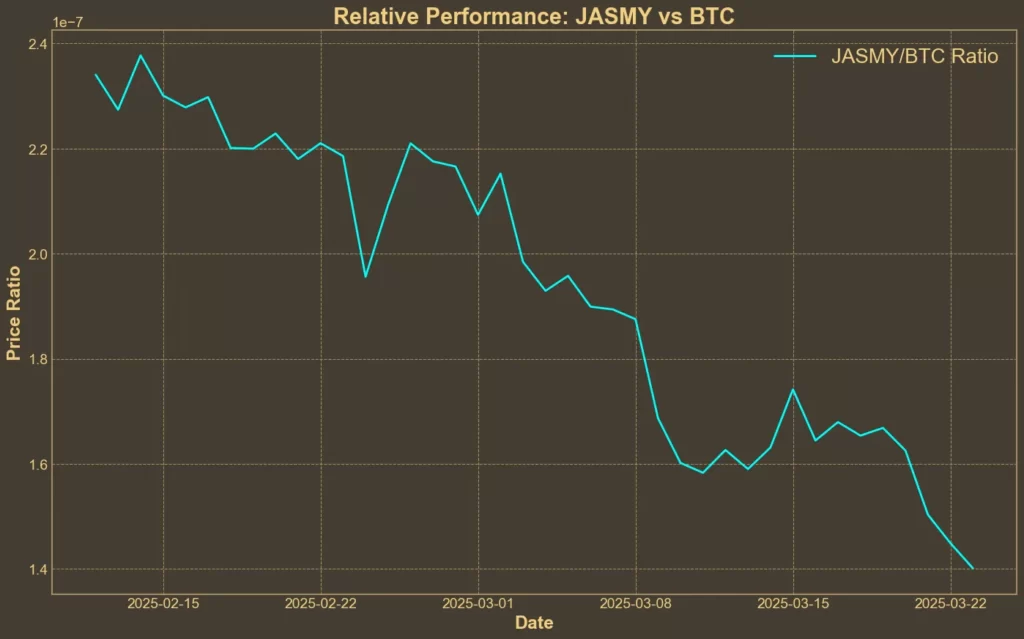
JasmyCoin is also losing ground against Bitcoin. The JASMY/BTC ratio is down nearly 15% this week and over 36% in the past month. This shows that JasmyCoin’s underperformance is not just a symptom of broader market weakness – it’s specific to this token. Among the top 100 cryptocurrencies, only Pi Network has performed worse over the last week.
Final Thoughts
The technical picture remains bearish across the board. Momentum is weak, trend indicators are stable but pointing downward, and the coin is trading far below its averages. The lack of divergence in RSI or AO means there’s little evidence of a bottom forming yet. While the MFI uptick suggests some inflows, they are not strong enough to flip the trend. Price needs to reclaim at least the $0.013 range before a short-term recovery can be considered.
That said, technical analysis is not a crystal ball. It does not account for sudden news, shifts in investor behavior, or strategic developments by the project. Right now, the charts suggest that JasmyCoin is stuck in a controlled decline, not a crash – but the trend is still down. Reversal will need real support from price and volume.


