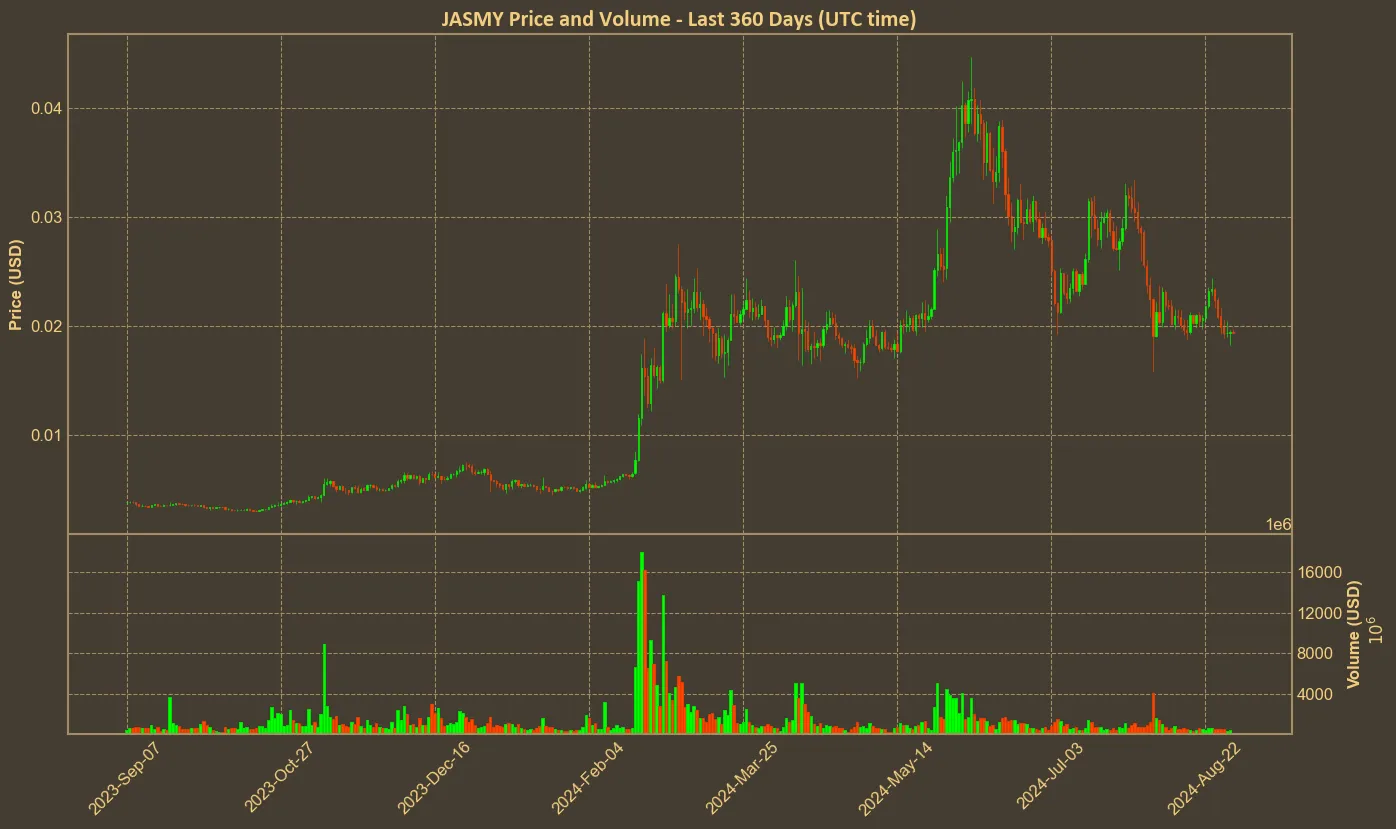
In recent months, JasmyCoin has experienced significant price fluctuations, with a notable downtrend. Over the last quarter, the cryptocurrency has seen a 44.69% decline in price, currently trading at $0.0194. Although JasmyCoin’s value soared by 446.24% over the last year, the recent downturn is creating buzz in the market. It’s important to examine the technical indicators to understand what might come next for this digital currency.

Market Activity and Volatility
The market cap for JasmyCoin has also seen shifts, falling by 31.95% in the last month to a current valuation of $0.96B. This decline is mirrored in trading volume, which has dropped by 45.31% over the same period. These steep declines emphasize a growing sense of caution among traders. However, these metrics alone don’t tell the whole story. When we dig deeper into the technical indicators, we get a clearer picture of the bearish sentiment pervading the market.
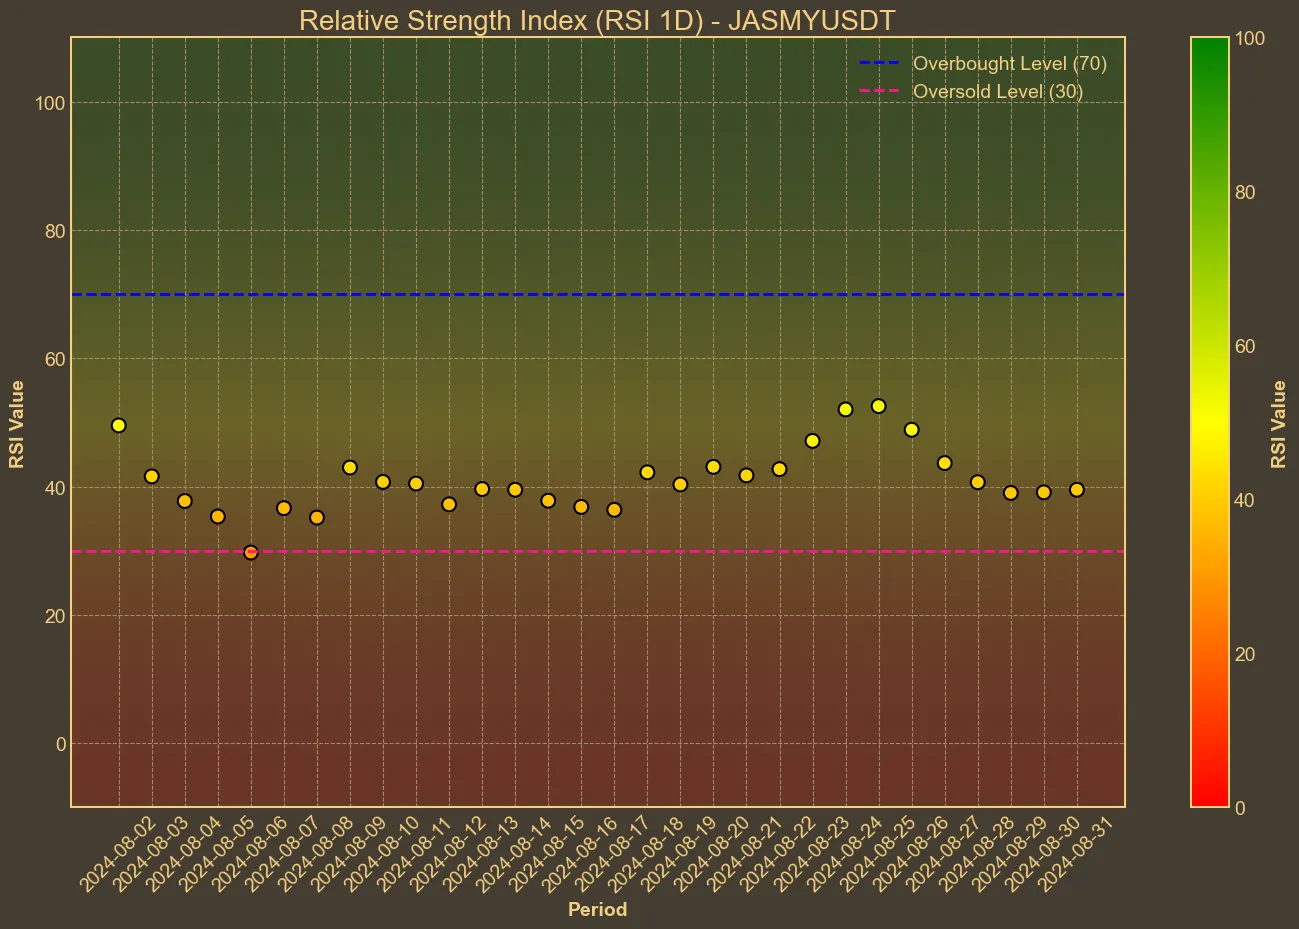
The recent Relative Strength Index (RSI) of 39 suggests that JasmyCoin is moving closer to oversold territory. Although not yet reaching critical levels, the downward trend in RSI over the past week hints at weakening momentum. Similarly, the Moving Average Convergence Divergence (MACD) of -0.0011 and the Awesome Oscillator (AO) of -0.0026 both confirm the bearish momentum.

Moving Averages and Future Implications
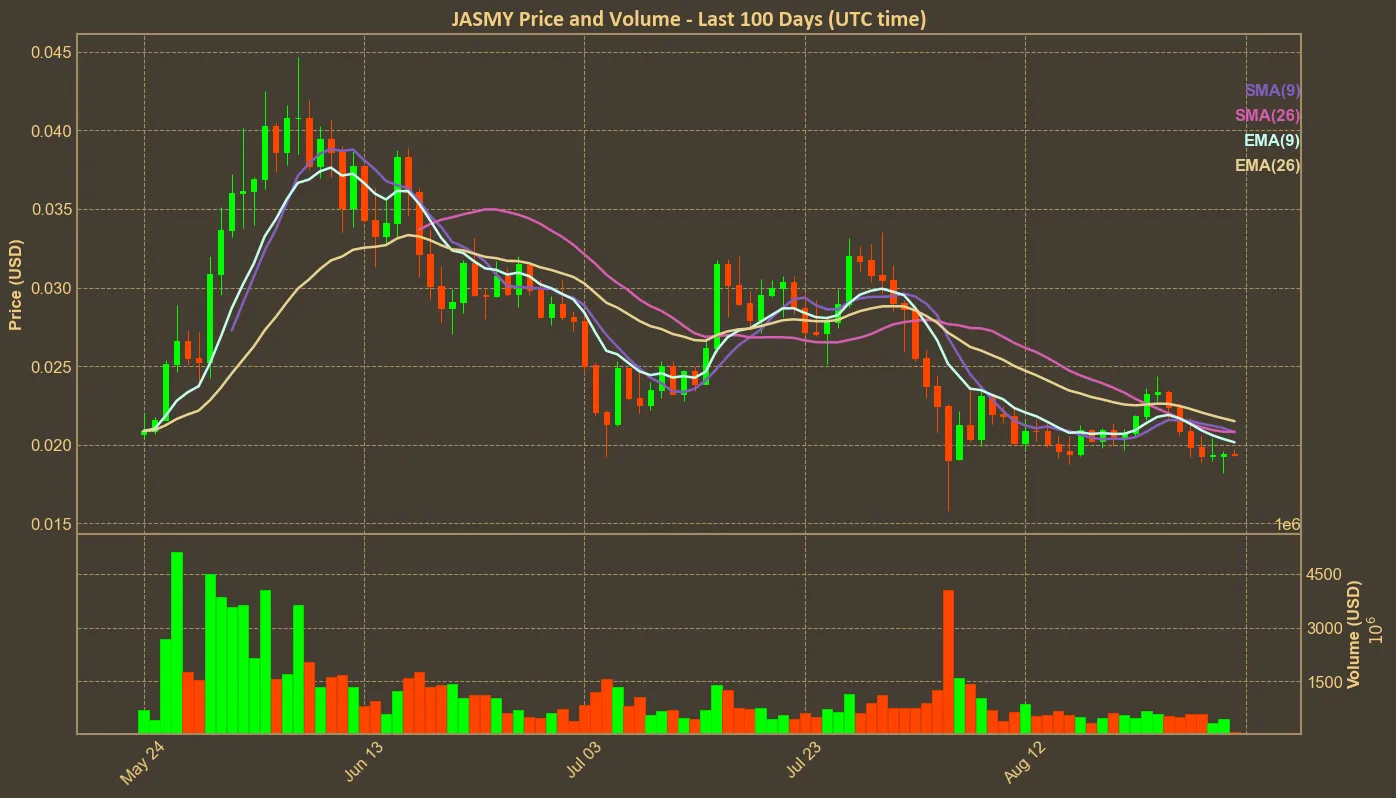
The Simple Moving Average (SMA) and Exponential Moving Average (EMA) also provide insights into the current state of JasmyCoin. The SMA today is 0.0208, just slightly below yesterday’s value, while the EMA stands at 0.0215. Both these averages are trending downward, which supports existing bearish sentiment. On top of this, Bollinger Bands, with the upper band at 0.0231 and the lower band at 0.0182, suggest a volatility range that the coin could navigate in the short term.

The Average True Range (ATR), a measure of volatility, stands at 0.0019, indicating that while JasmyCoin is indeed volatile, it’s not exceptionally so compared to other assets of similar nature. This ATR value hints that traders should remain vigilant, as any significant shift could temporarily alter this stability.
Final Thoughts
While the data indicate that JasmyCoin is currently experiencing a bearish trend, these technical indicators also point to potential turning points. As the RSI approaches oversold territory, traders might start seeing opportunities for a rebound if buying pressure can outweigh the prevailing bearish sentiment. However, technical analysis has its limitations and cannot predict future movements with certainty. External factors, such as regulatory news and market sentiment, can dramatically impact performance. Therefore, traders must consider a diverse range of data and remain adaptable to changing market conditions.


