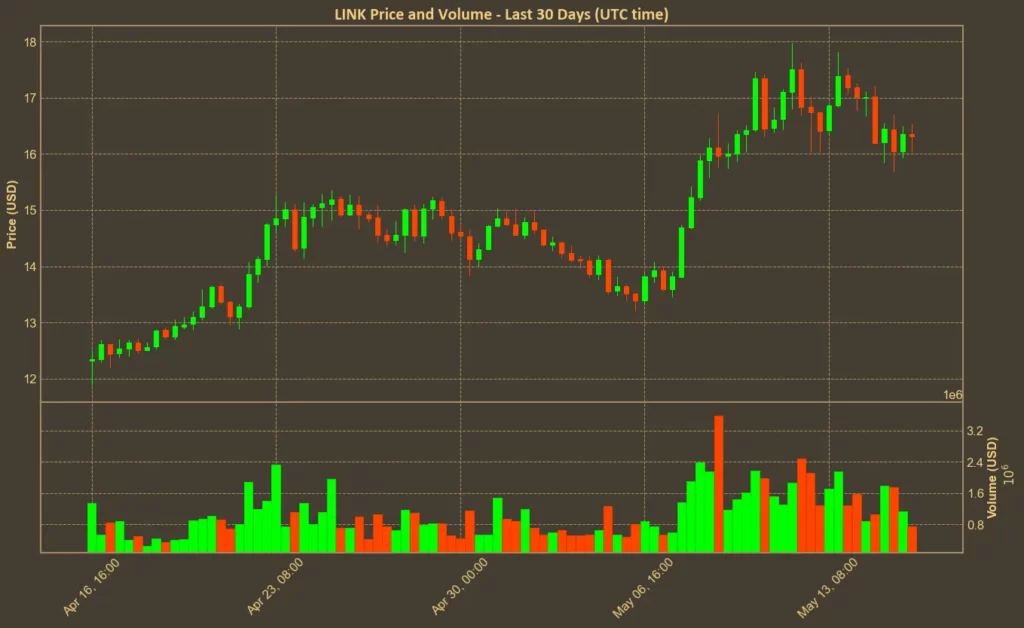
Chainlink is back in the spotlight, with LINK climbing over 34% in the past month. After spending much of the previous quarter under pressure, this recent surge has caught attention. But the bigger picture is more mixed. While the token is showing strength again, its momentum is still facing resistance in several areas.

At the time of writing, LINK trades at $16.3 and sits at #12 by market cap. Short-term gains are clear, but some long-term holders are still underwater from the previous highs – in December 2024 the coin was trading nearly at $30.
Read also: Can You Really Get Rich Quick By Achieving Daily 1% Gains?
Table of Contents
Click to Expand
Momentum Indicators
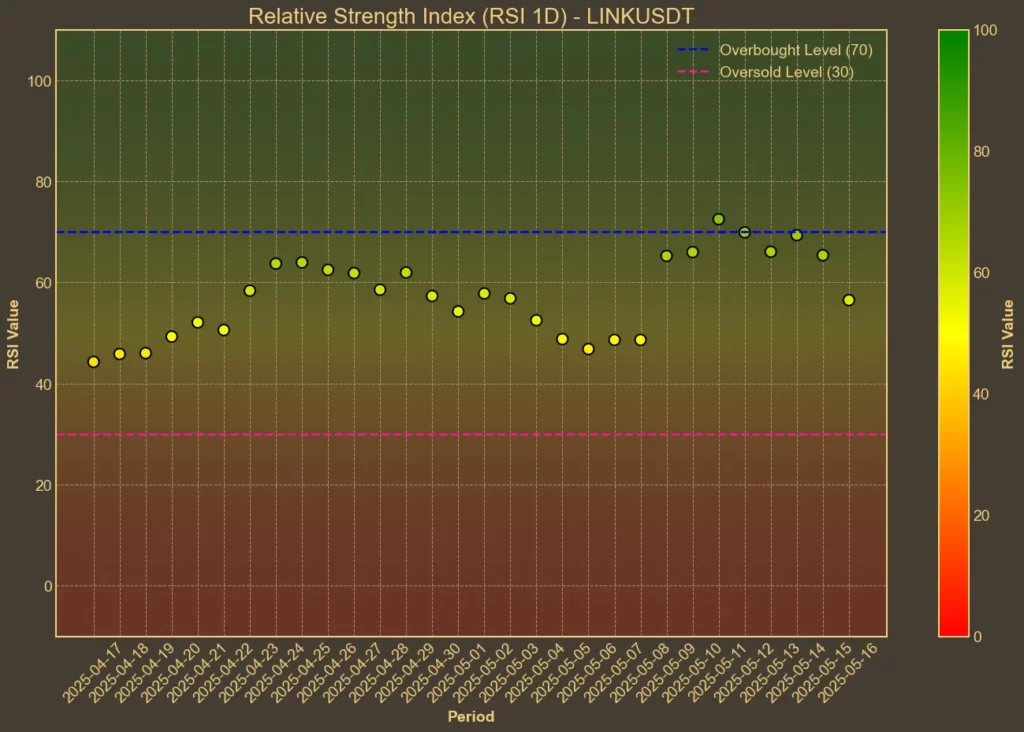
RSI: Neutral
The RSI (Relative Strength Index) is used to identify whether the coin is overbought or oversold. LINK’s RSI(14) is now 58 – up from 56 yesterday, though still lower than the 66 from a week ago. Short-term RSI(7) sits at 55. These levels suggest a healthy interest without being overheated. Momentum has cooled slightly since last week, but it hasn’t reversed.

MFI: Neutral
MFI (Money Flow Index) adds volume to the RSI calculation. It’s sitting at 55 today, after drifting slightly from 59 earlier in the week. That shows a flattening demand, with volume still supporting price, but no strong buying pressure entering right now.
Fear & Greed Index: Greed
The broader crypto market shows high confidence. The Fear & Greed Index has been sitting in the low 70s all week, peaking at 73. While this isn’t specific to LINK, it suggests an overall appetite for risk remains high.

Moving Averages
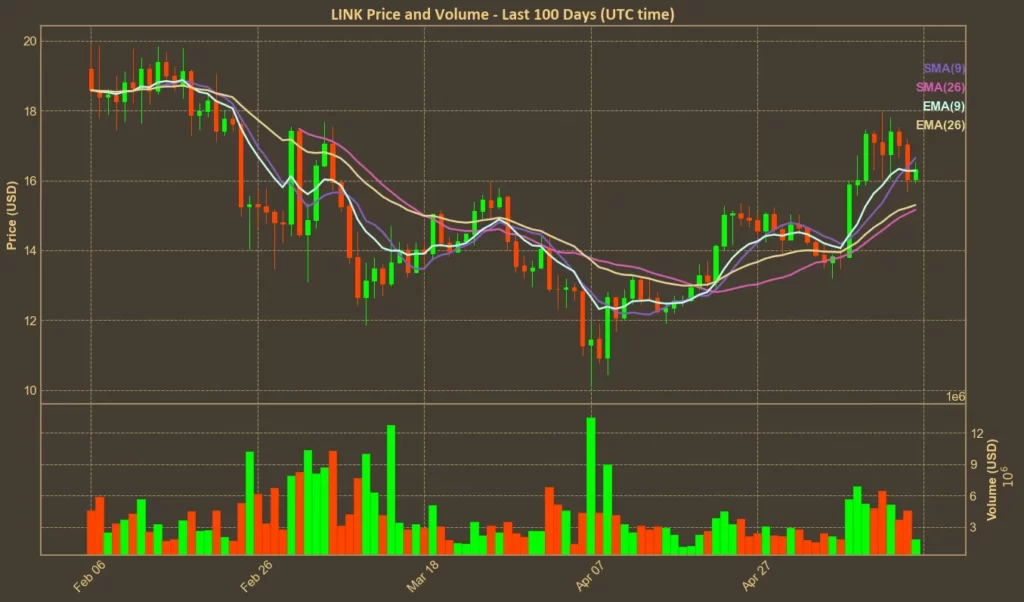
SMA & EMA: Bullish
Short-term moving averages confirm the current price is aligned with the recent uptrend. LINK’s SMA(9) is $16.65 and EMA(9) is $16.28 – both slightly above the current price. Meanwhile, longer-term averages like the SMA(26) and EMA(26) are still below at $15.16 and $15.3, respectively. That points to LINK sustaining a breakout above previous resistance levels.

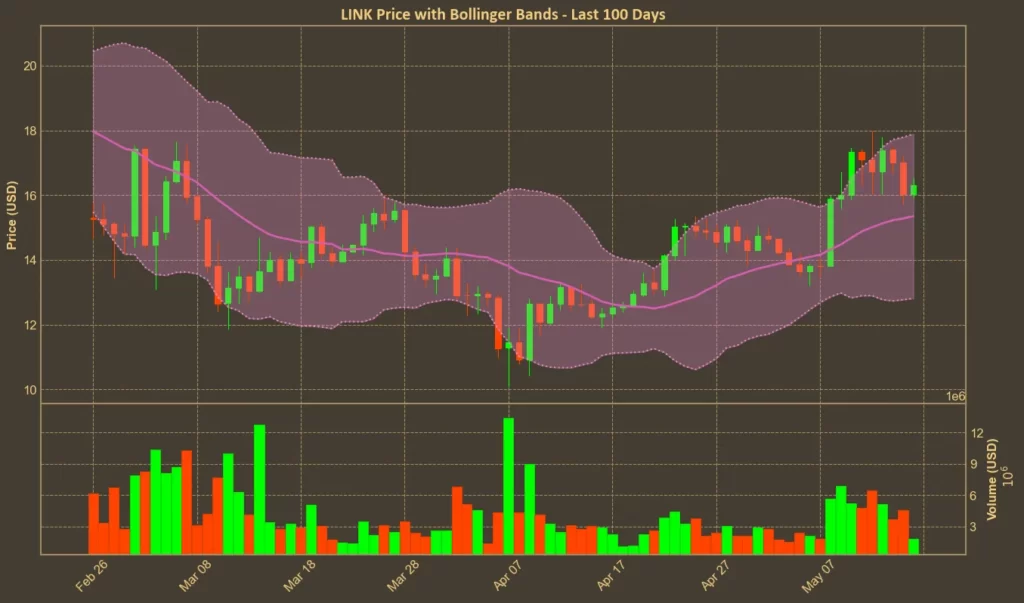
Bollinger Bands: Increased Volatility
The Bollinger Bands are showing wide spacing – $17.9 on the upper band and $12.81 on the lower. This gap confirms high volatility. The price sits closer to the upper band, suggesting some short-term overbought conditions, but also that the breakout is holding for now.

Trend & Volatility Indicators
ADX: Strengthening Trend
ADX at 25 shows that a trend is forming. It’s up from 18 a week ago, which marks a clear strengthening. While not explosive, it reflects a move from sideways action into a real upward trajectory.
ATR: High Volatility
ATR is at 1.07 – slightly lower than yesterday but still elevated from last week. That means swings are larger than average, and traders should expect more price movement in the near term.
AO: Bullish
The Awesome Oscillator jumped from 0.92 to 2.22 within a week. It’s declining slightly today, but still shows strong upward momentum. A trend reversal isn’t on the table yet – this still leans bullish.
VWAP: Bullish
The current VWAP sits at $15. That puts LINK well above the weighted average price, supporting the idea that the market is willing to pay a premium to acquire the token at these levels.
News Catalysts
Chainlink’s recent momentum isn’t just about charts. The protocol has been involved in some key developments that may influence investor confidence in the next weeks.
First, Chainlink is launching a $200,000 competitive audit tied to its new version of Chainlink Rewards. The contest begins June 16 and shows both confidence in the protocol’s stability and a focus on incentivized transparency. These types of audits often draw attention from researchers, devs, and investors.
Chainlink has also been directly involved in shaping SEC guidance. In meeting with U.S. regulators, the team helped address how public blockchains can be used to meet compliance requirements around broker-dealers and transfer agents. The SEC’s updated guidance released this week reflected several of those contributions:
Conclusion
The technical indicators for Chainlink are generally leaning positive. RSI and MFI show healthy buying interest, without extreme pressure. Trend indicators like ADX and AO confirm that a directional move is gaining strength. Moving averages and VWAP support this as well.
With upcoming product audits, regulatory engagement, and real-world tokenization pilots, the current uptrend has more than just momentum behind it. Still, technical analysis alone can’t predict the next move – it doesn’t account for unexpected market news or events. But right now, Chainlink looks like a project with both direction and relevance.
Read also: RSI: The Beginner’s Tool That Most People Use Wrong


