Litecoin has been struggling to find a clear direction in recent weeks. The current price of $92 reflects a slow grind rather than any decisive trend. Compared to a month ago, the coin has lost nearly 20% of its value. Shorter timeframes show more stabilization – weekly and daily changes hover around zero.
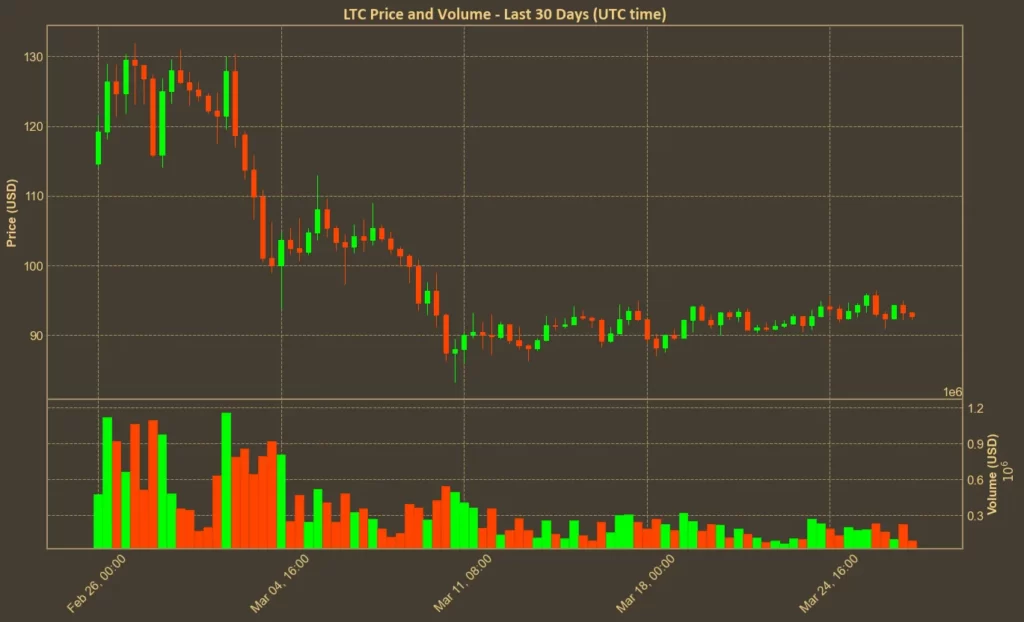
Market cap has followed suit, with a 19.5% drop over 30 days, and trading volume has fallen by over 70%. These numbers paint a picture of fading interest. But technical indicators suggest that momentum might be quietly shifting.
Table of Contents
Momentum Indicators
RSI: Neutral
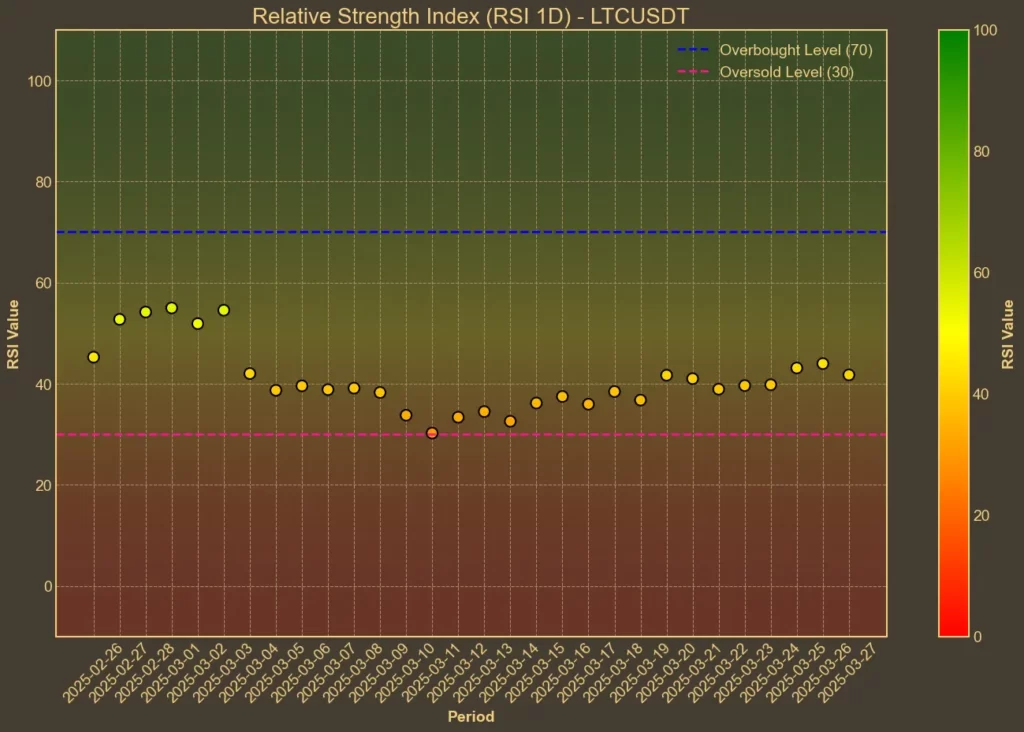
The Relative Strength Index helps measure if an asset is overbought or oversold. Litecoin’s RSI(14) sits at 42, unchanged from yesterday, and not far from the reading a week ago. The short-term RSI(7) has ticked up slightly from 45 to 47. These values suggest a neutral setup – no strong signals, but some room for upward movement.
Read also: RSI: The Beginner’s Tool That Most People Use Wrong
MFI: Bullish
The Money Flow Index combines price and volume to gauge the strength of capital inflows. MFI(14) has moved from 41 a week ago to 68 today. That’s a clear shift. Despite the low trading volume overall, the data points to renewed buying activity under the surface.
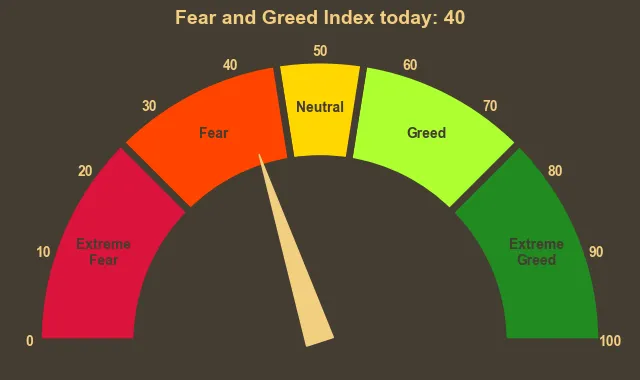
Fear & Greed Index: Fear
The broader crypto market has dipped into “fear” territory. The index dropped from 49 a week ago to 40 today. While this isn’t extreme, it suggests traders remain cautious – waiting, not panicking.
Moving Averages
SMA & EMA: Bearish
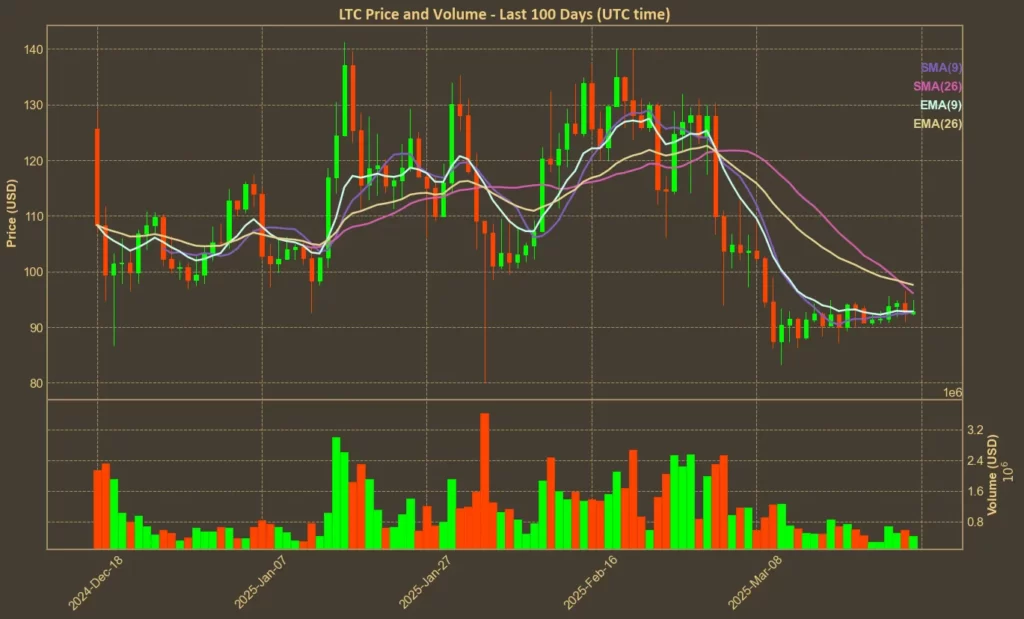
Litecoin is now below both its 26-day simple and exponential moving averages. Short-term averages are near the current price, with SMA(9) at 92.72 and EMA(9) at 92.81, but longer-term averages are higher – SMA(26) at 96.1 and EMA(26) at 97.59. That spread hints at persistent downward pressure.
Bollinger Bands: Low Volatility
The upper and lower bands are at 98.2 and 86.33, respectively. Litecoin is trading in the middle of this range, which often signals consolidation. The lack of strong price movement toward either band reinforces the idea that volatility has cooled, at least for now.

Trend & Volatility Indicators
ATR: Falling Volatility
ATR has dropped from 8.18 last week to 6.25 today. The lower value reflects a period of shrinking price swings, echoing the message from Bollinger Bands.
AO: Weakening Bearish Momentum
The Awesome Oscillator remains in negative territory but is moving upward – from -19.06 a week ago to -9.73 today. That’s a significant improvement. While momentum is still bearish, it’s clearly losing steam.
VWAP: Bearish
Litecoin’s VWAP is $113.65 – well above the current price. This means recent trades are happening below the average weighted by volume, often interpreted as a bearish sign.
Relative Performance
Comparison Against BTC: Underperforming
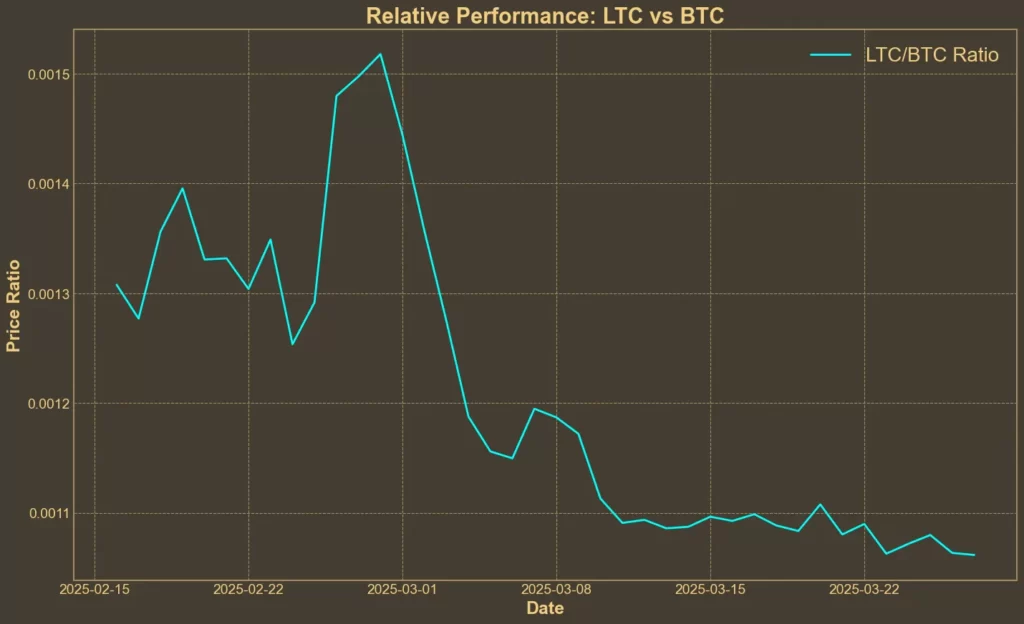
LTC has lost ground against Bitcoin. The LTC/BTC ratio has dropped over 4% in the past week and more than 28% in the last 30 days. That kind of underperformance typically discourages new entries and may explain the sharp fall in trading volume.
What’s the Outlook?
Technicals tell a mixed story. On one hand, Litecoin remains stuck under key moving averages and is trading below its VWAP. But on the other, momentum indicators like MFI and AO show signs of early recovery. RSI is neutral, and volatility is down. The data doesn’t point to a clear breakout yet, but it does suggest Litecoin might be building a base.
Newswise, there’s been some movement worth watching. The Litecoin Foundation has just confirmed a historic hashrate high:
There’s also speculation about Litecoin being included in upcoming ETF products. On Polymarket, the odds of a Litecoin ETF being approved this year are currently priced at 73%. If that happens, it could shift the coin’s narrative and attract more institutional capital – potentially outweighing short-term technical signals.
Read also: Hashdex Pushes for Expanded Crypto ETF with SEC Filing

