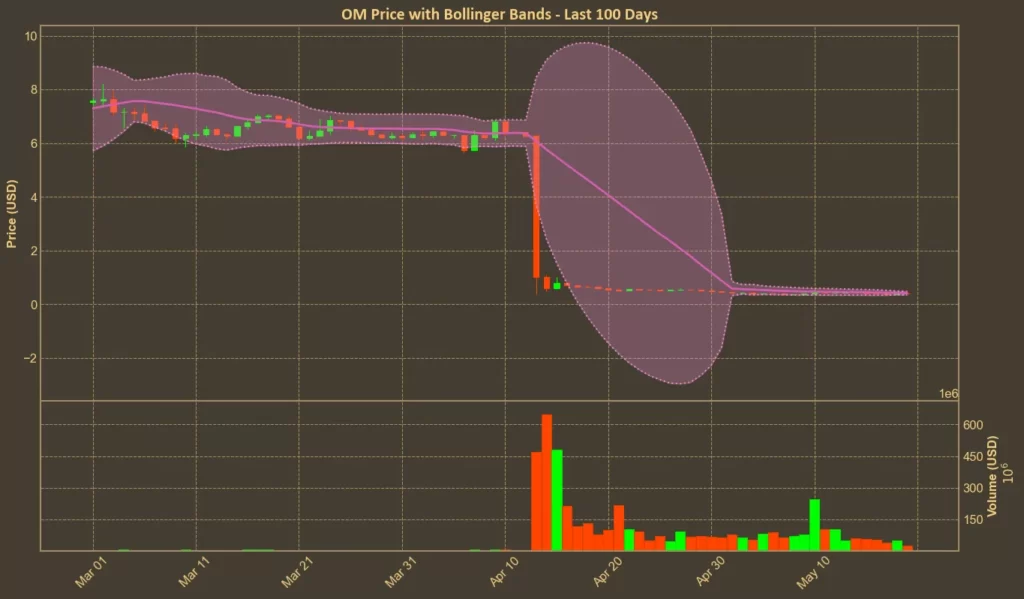
A month after one of the fastest collapses seen in any top-ranked crypto project, Mantra is still trading well under $0.50 – and most technical indicators suggest it may stay there. While the team has been vocal and active since the crash, launching transparency tools and burning a large chunk of supply, the chart shows none of it has changed how the market views OM.
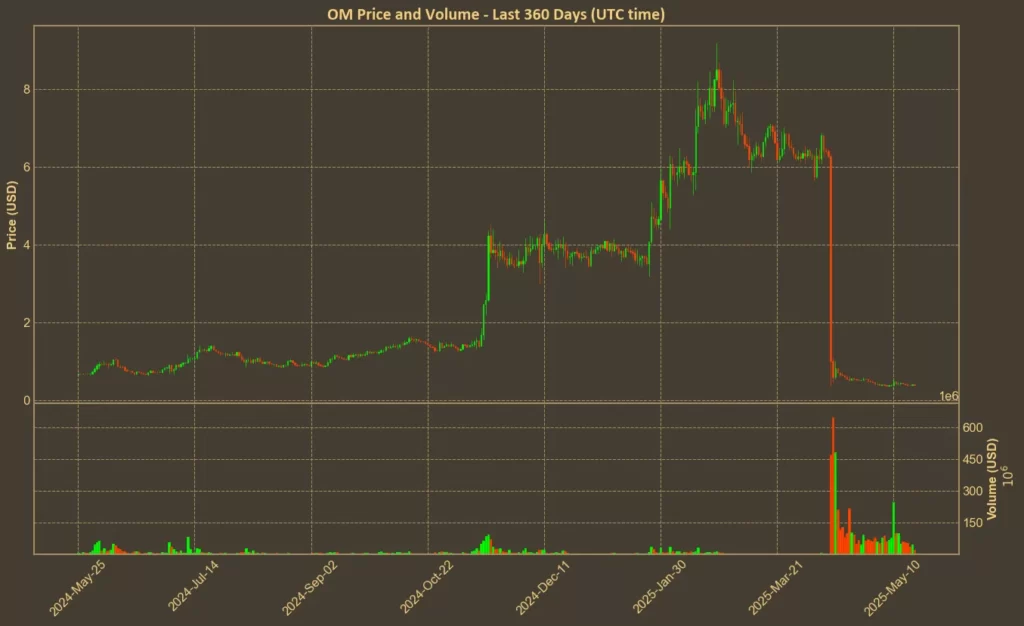
The crash on April 13 wasn’t caused by a smart contract bug or team exit – it was, according to the official explanation, a liquidation spiral triggered by centralized exchanges. That context matters, especially when looking at the technical indicators now.
What we’re seeing now is a token that’s stuck in its post-crash range – with few signs of buyers stepping in. Some metrics hint at slowing downward momentum, but the broader trend hasn’t changed.
Table of Contents
Click to Expand
Momentum Indicators
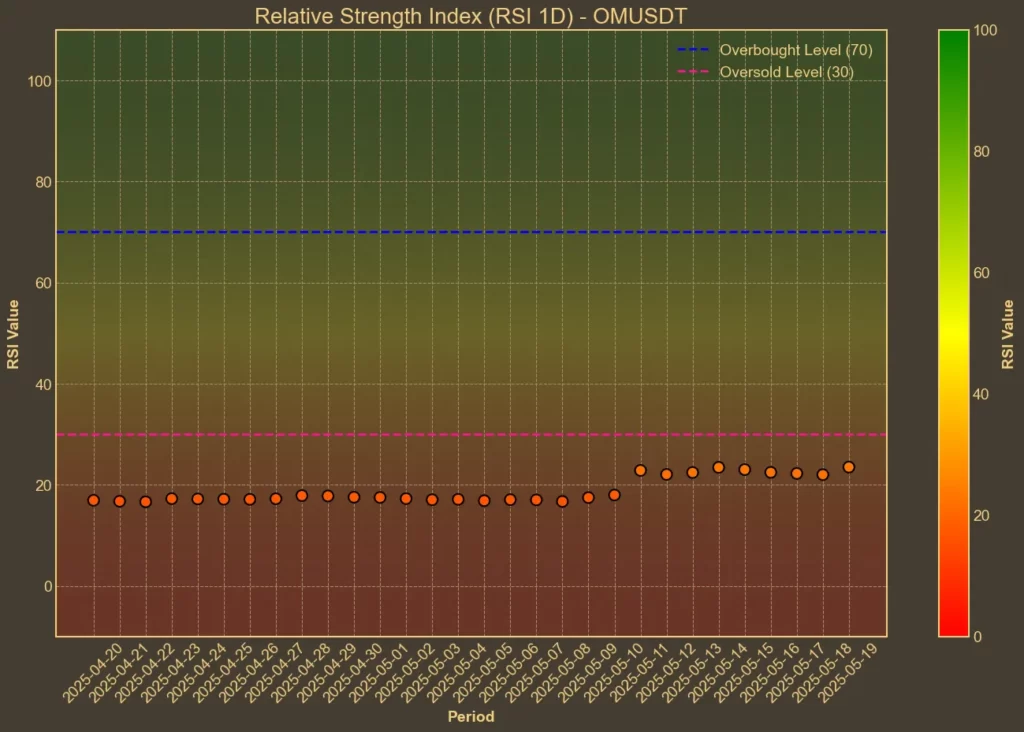
RSI: Constantly Oversold
The Relative Strength Index is still deep in oversold territory. RSI(14) has hovered around 23 for over a week, and the short-term RSI(7) is now at 36. This reflects prolonged selling pressure. In most cases, such low RSI values would suggest a possible bounce – but here, the oversold condition is persistent. That usually signals weakness, not opportunity.
Read also: RSI: The Beginner’s Tool That Most People Use Wrong
MFI: Neutral
The Money Flow Index, which includes volume, tells a slightly different story. It’s risen from 39 to 55 in a week, suggesting some capital has returned to the token. But the range isn’t high enough to be bullish. Volume itself has dropped sharply since the crash, and this increase might be more about temporary stabilization than real accumulation.
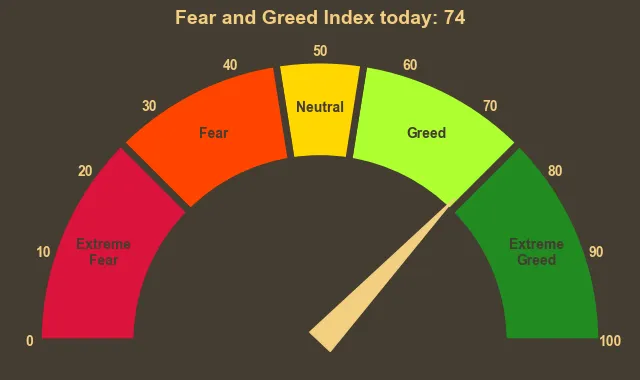
Fear & Greed Index: Greed
The broader crypto market is showing optimism, with the Fear & Greed Index at 74. But OM is clearly decoupled from that sentiment. The greed is not translating into buying here, reinforcing the idea that Mantra’s issues are project-specific.
Moving Averages
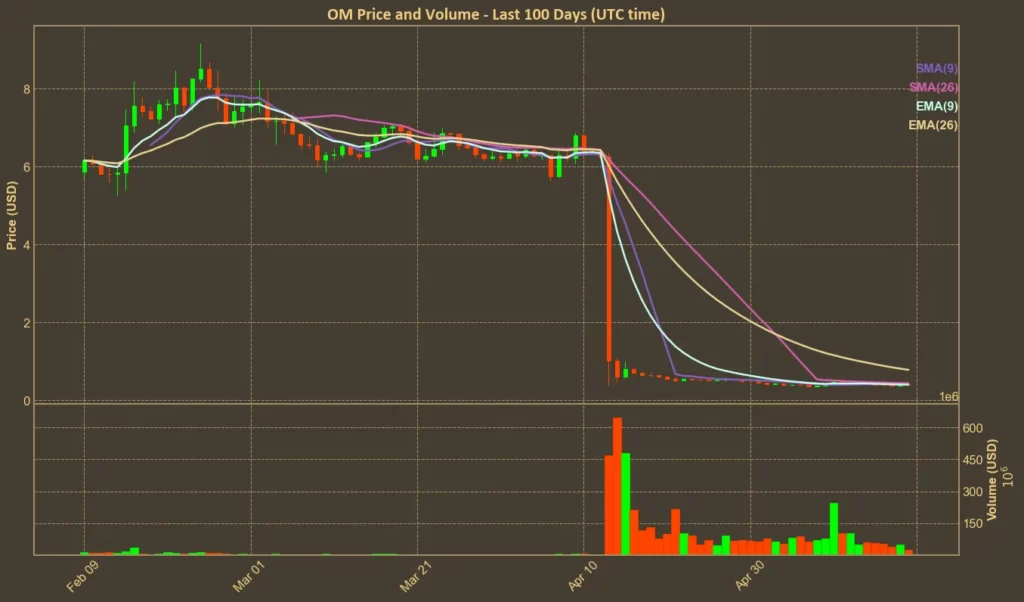
SMA & EMA: Bearish
All short-term and mid-term moving averages remain above OM’s current price. SMA(9) is at 0.4055 and EMA(9) at 0.4008, both clear resistance levels. EMA(26) is still far higher, near 0.78 – a reminder of just how far OM has dropped. Until the price breaks above at least the 9-day averages, the downtrend is intact.
Bollinger Bands: Increased Volatility
Bollinger Bands have widened, with the lower band now at 0.3436. OM is trading close to that line, which would normally suggest a potential reversal. But this pattern has repeated since mid-April with no sustained bounce, meaning volatility is up – but direction is still unclear.
Trend & Volatility Indicators
ADX: Strong Downtrend
The Average Directional Index is holding at 60, confirming that the current trend – which remains downward – is strong. There’s no sign of reversal pressure from this indicator.
ATR: Decreasing Volatility
The ATR has dropped from 0.15 to 0.10 in the past week, suggesting that the most violent price swings are over. But this isn’t necessarily bullish – it often signals the market is entering a consolidation phase, not a recovery.
AO: Bearish
The Awesome Oscillator remains negative, though the drop has slowed. This suggests bearish momentum is still there, but fading slightly. Without a shift to green bars, however, there’s no sign of bullish trend forming.
VWAP: Bearish
VWAP is at 1.0696 – far above the current price. This gap isn’t unusual after a crash, but it shows that most of the recent trading activity happened at much higher levels. It also reinforces how few participants are currently willing to buy in this range.
Relative Performance
Comparison Against BTC: Very Weak
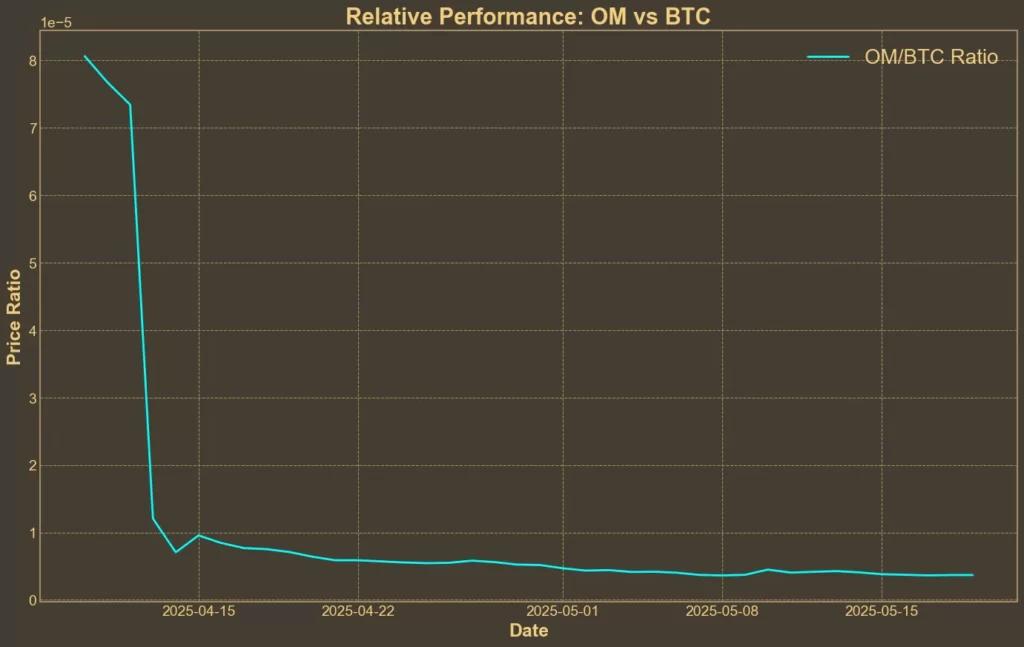
OM/BTC ratio has dropped over 11% in the last seven days and more than 42% in a month – and both of these metrics are already after the 90% crash. Even after the collapse, Mantra is still losing ground to Bitcoin.
Summary
The technical picture reflects what’s already happened: OM is still in the shadow of the April crash. Volume has dried up, momentum is still negative, and no major indicator has turned positive. The 150 million token burn, announced and confirmed, had little visible impact on price.
Technical analysis can’t predict future events – especially in situations like this, where confidence is the key missing piece. Even if the indicators start turning neutral or slightly positive, OM will likely stay pinned unless the team follows up with direct, market-visible action. For now, it’s a chart with no clear support, no reversal pattern, and no sign that the selloff has run its full course.
Read also: 4 Reasons Why Investors Aren’t Coming Back to Mantra (OM)


