NEAR Protocol is in a difficult position. Its current price of $2.38 marks a serious drawdown from previous highs, with losses stacking up across every time frame. Over the past year, it’s dropped over 65%, and more than 30% just in the last three months.
The trend is clearly downward, and volume has also thinned out – falling by nearly 28% over the past month. While NEAR still holds a respectable position in the top 35 by market cap, technical indicators show that it may not be done bleeding just yet.
Table of Contents
Click to Expand
Momentum Indicators
RSI: Neutral
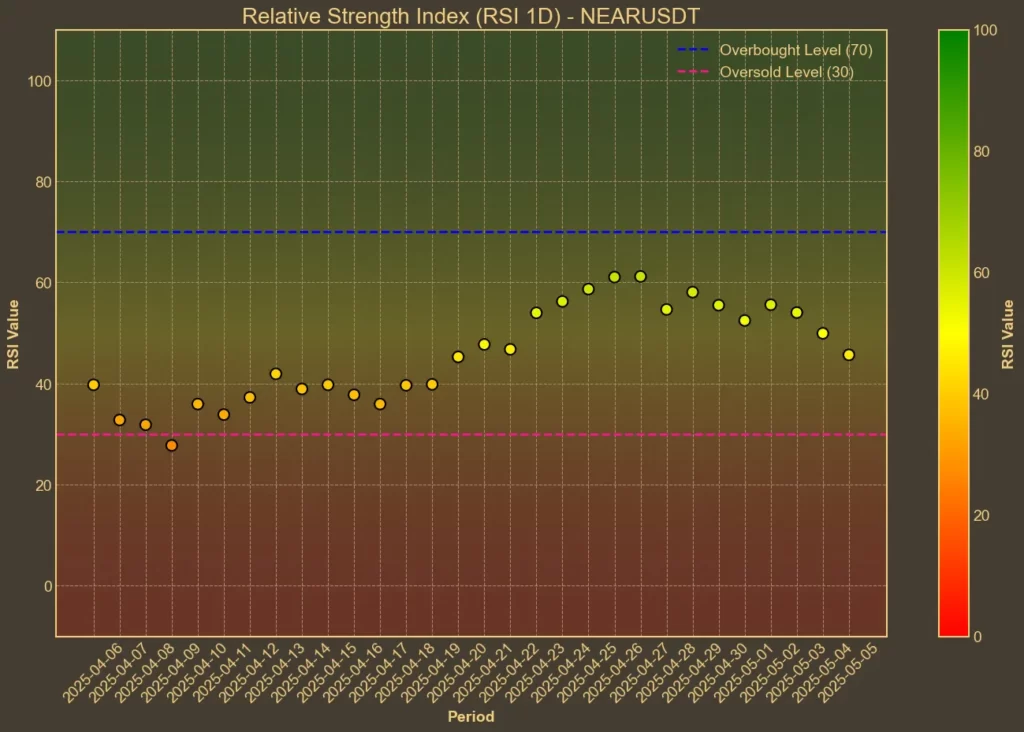
The Relative Strength Index has dropped from a recent high of 58 last week to 48 today. Short-term RSI(7) is at 44. This isn’t yet in oversold territory, but it’s not far either. The small bounce from yesterday’s RSI(7) of 38 suggests that selling pressure may be easing slightly, but there’s no strong sign of reversal.
MFI: Overbought
The Money Flow Index is unusually high for a coin that’s been trending down. Sitting at 74, it implies that recent buying volume has been significant – possibly driven by short-term speculation. MFI levels this high often precede a correction. It could mean that any positive price moves from here are at risk of fading quickly.
Fear & Greed Index: Neutral
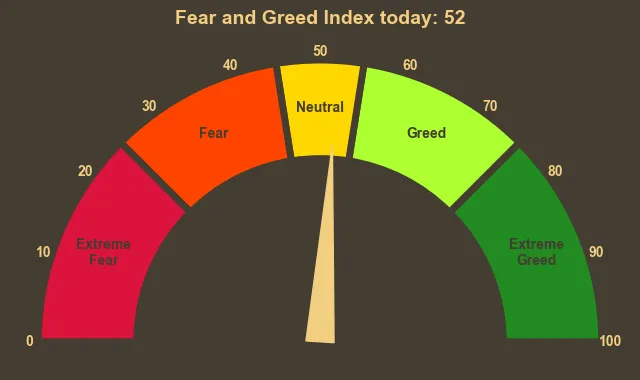
This index measures broader crypto sentiment, and it’s been steadily dropping. From 67 just three days ago, it has now hit 52. It’s a shift from strong greed to nearly neutral, which lines up with falling prices across the market. The mood is more cautious now.
Moving Averages
SMA & EMA: Inconclusive
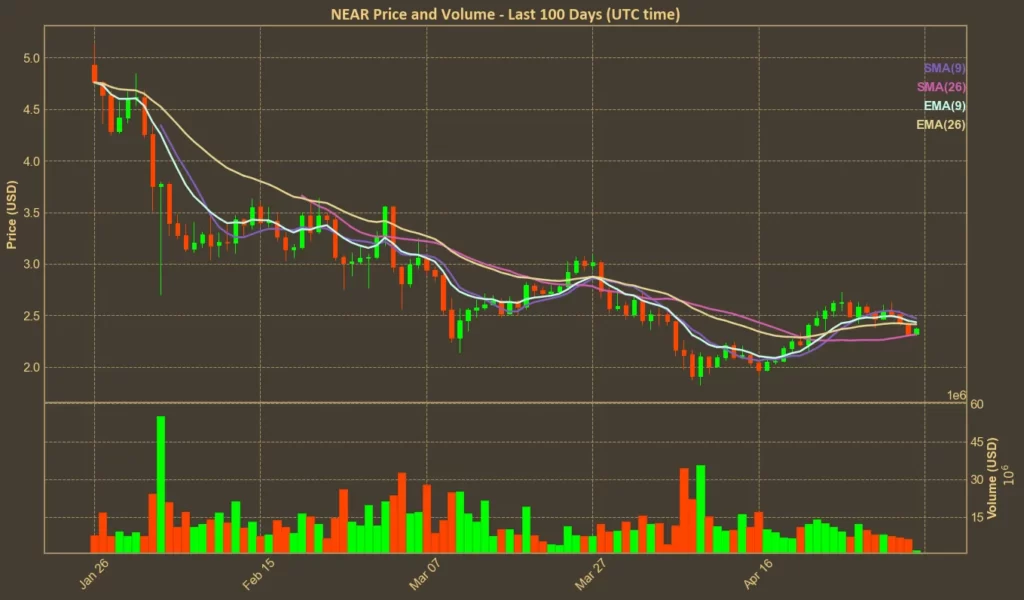
Short-term averages are mixed. The 9-day Simple Moving Average (SMA) is at $2.47 – slightly above the current price – while the 9-day Exponential Moving Average (EMA) is closer at $2.43. Meanwhile, longer-term 26-day moving averages are almost equal to current price. It suggests a loss of clear momentum in either direction. Price is stuck between averages, which often reflects indecision.
Bollinger Bands: Increased Volatility
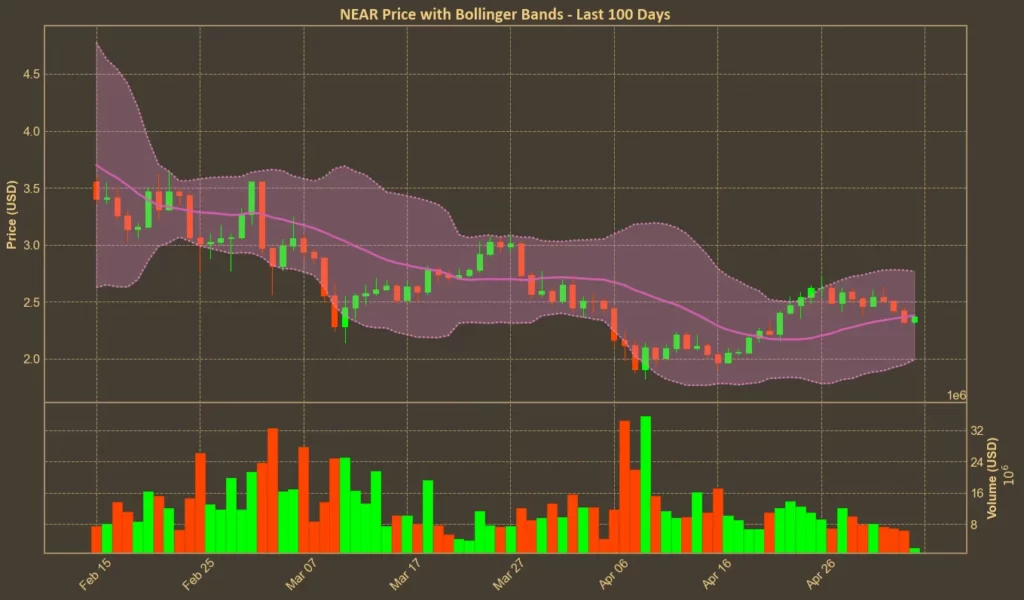
With the upper band at $2.77 and the lower at $1.99, NEAR has room to move in either direction. But the fact that the price is drifting closer to the lower band could mean downside pressure is still present. This positioning typically signals that the market sees more risk than upside in the near term.
Trend & Volatility Indicators
ADX: Weak Trend
At 19, the Average Directional Index is sitting below the 20 mark that traders usually see as the threshold for a real trend. A week ago, it was 26, which means the previous trend (in this case, down) has weakened. But it hasn’t been replaced by a new one. That’s a warning that price could drift sideways without direction for a while.
ATR: Low Volatility
The Average True Range is currently 0.17, down from 0.19 last week. This tells us that daily price movements are getting smaller. It may sound like a relief, but in downtrends, low ATR often means buyers aren’t showing up with enough strength to stop the decline.
AO: Bearish
The Awesome Oscillator has been ticking lower for the past week, now reading 0.15. That’s not a collapse, but the downtrend in AO confirms the price weakness already visible on the chart.
VWAP: Bearish
Volume-weighted average price is $2.88 – well above where NEAR is trading. When a coin trades this far below VWAP, it usually signals that buyers who entered earlier are underwater. If the price fails to close that gap soon, those holders may start exiting and add more pressure.
Relative performance
Comparison Against BTC: Underperforming
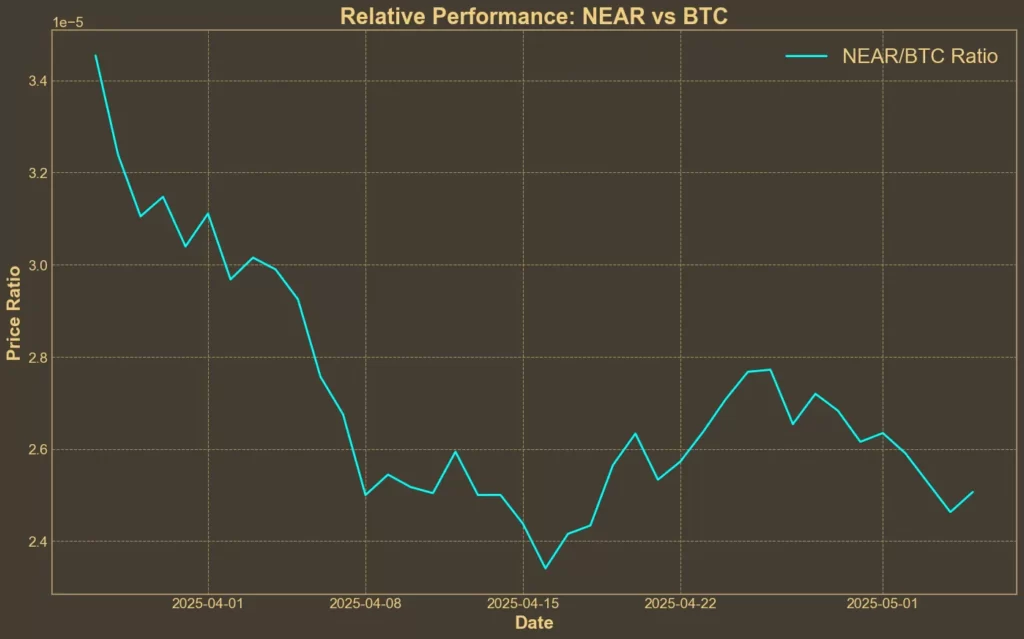
The NEAR/BTC ratio has dropped almost 8% over the last week, and 9% over the past month. That’s not a good sign. It shows that NEAR is losing value against Bitcoin. This points to specific weakness in NEAR rather than just broader market fatigue.
What’s Next?
NEAR Protocol has pulled back from its recent price spike, linked to the AI-token rally earlier. The current chart shows a loss of momentum, with most indicators pointing to weakness or sideways drift.
While some metrics like MFI hint at speculative interest still hanging around, the lack of a clear trend or strong support from volume suggests this may just be a cool-off after short-term hype, rather than the start of a new cycle.
Read also: Virtuals Protocol Surges – But Warning Signs Remain


