Pepe’s price today stands at $0.0000093, marking a small daily rise of around 1%. Despite this, the coin remains down nearly 32% over the past month. Its market cap is now at $3.85 billion, showing that although prices have dropped, the project retains significant value in the market.
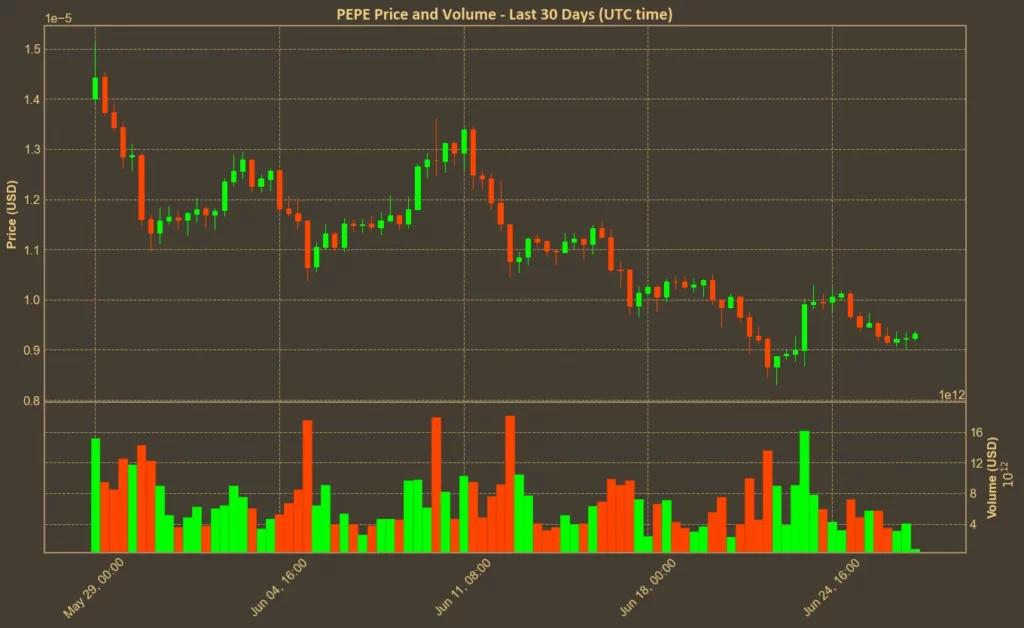
Table of Contents
Click to Expand
Momentum Indicators
RSI: Neutral
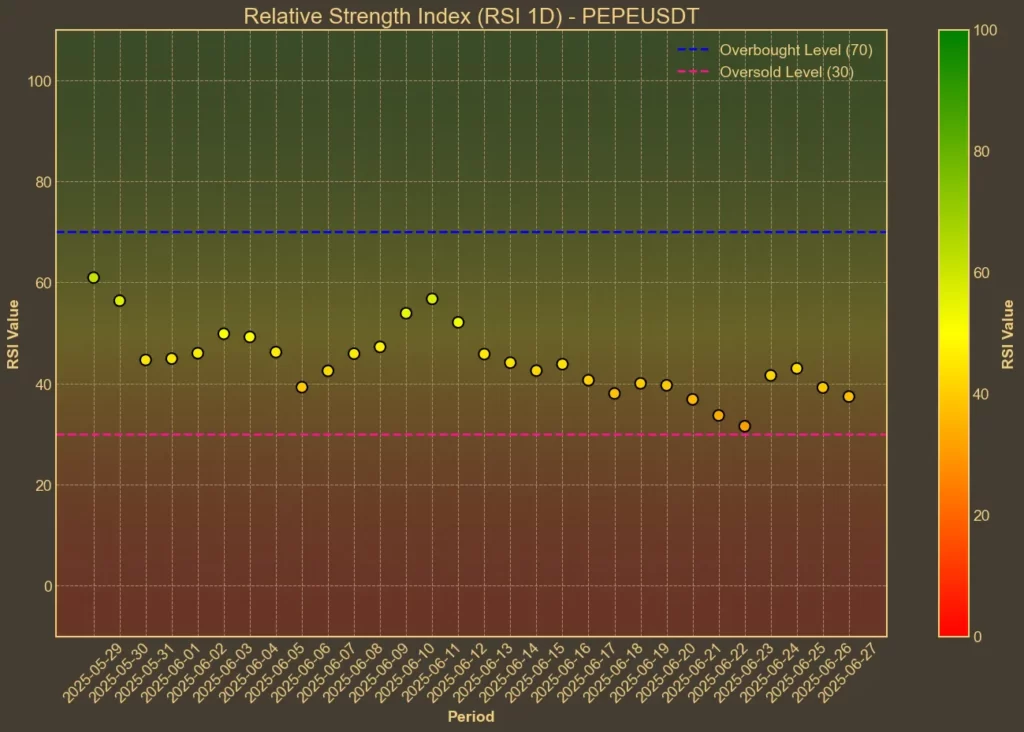
RSI measures whether an asset is overbought or oversold. Today, Pepe’s RSI(14) is at 39, slightly higher than yesterday’s 37. Short-term RSI(7) is at 37. These values suggest momentum remains weak and near oversold levels.
MFI: Oversold
The Money Flow Index (MFI), which incorporates both price and volume, is at 29 today, rising from 26 yesterday. An MFI below 30 often indicates oversold conditions, suggesting limited buying pressure recently.
Fear & Greed Index: Greed
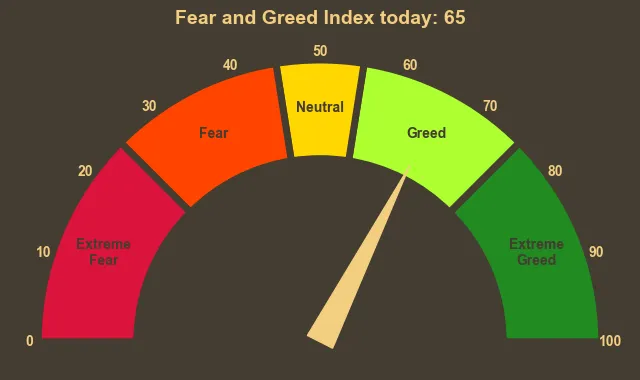
This index shows the overall market sentiment rather than Pepe alone. Today it reads 65, up from 54 a week ago. It reflects a general market leaning towards greed despite Pepe’s price weakness.
Moving Averages
SMA & EMA: Bearish
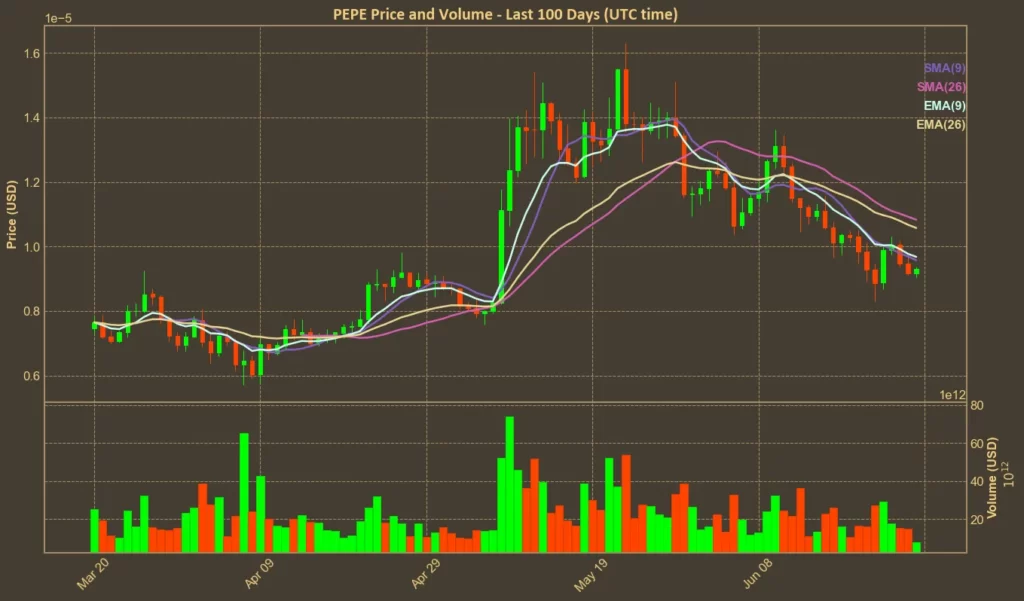
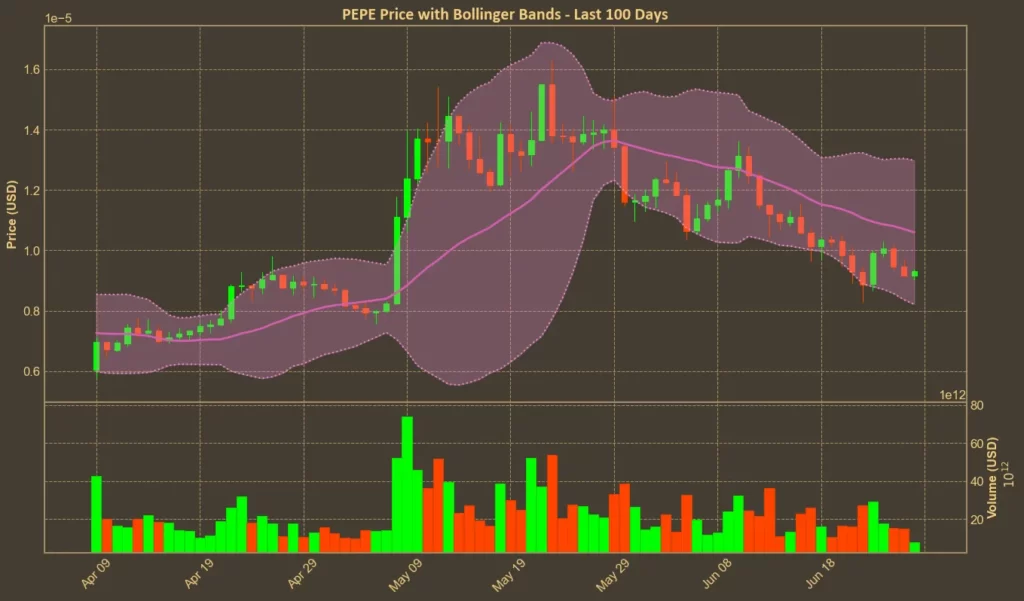
Moving averages help identify trend direction. Pepe’s SMA(9) and EMA(9) remain below the longer SMA(26) and EMA(26). This alignment typically points towards a bearish trend.
Bollinger Bands: Low Volatility
Bollinger Bands measure volatility and potential breakout levels. Today, the upper band is at 1.2983e-05 and the lower at 8.212e-06. Pepe’s current price sits closer to the lower band, suggesting oversold conditions with minimal volatility expansion.
Trend & Volatility Indicators
ADX: Weak Trend
ADX shows trend strength. Pepe’s ADX(14) is at 24 today, slightly up from 20 a week ago. It indicates a weak but gradually strengthening downward trend.
ATR: Low Volatility
ATR measures price volatility. Pepe’s ATR(14) is at 9.41e-07, slightly down from last week, indicating continued low volatility in its price movements.
AO: Bearish
The Awesome Oscillator assesses market momentum. Pepe’s AO remains negative at -1.839e-06 today, confirming bearish momentum.
VWAP: Below Average
VWAP indicates whether price trades above or below its volume-weighted average. Pepe’s VWAP today is 1.0397e-05, placing its current price below this level and suggesting sellers remain in control.
Relative Performance
Comparison Against DOGE: Falling
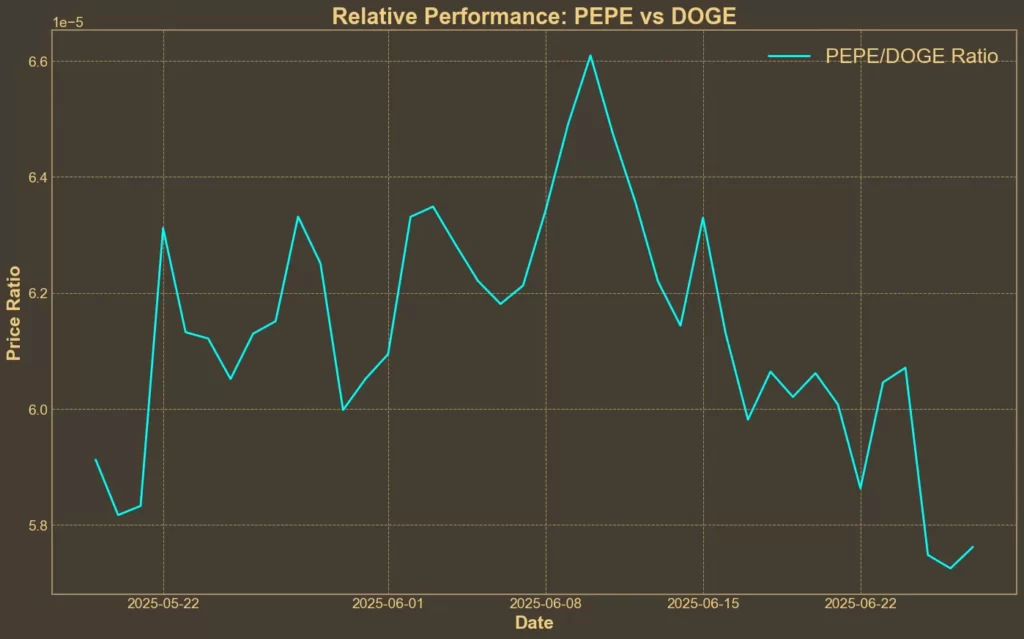
The PEPE/DOGE ratio has declined by 5% over the past week and around 8% in the past month. This shows weaker performance relative to Dogecoin, the biggest memecoin on the market.
Summary
Overall, technical indicators show Pepe is in a bearish phase with weak momentum and low volatility. This might be caused by the recent news of a large whale selling over 531 billion PEPE tokens at a realized loss. However, exchange flow data indicates more withdrawals than deposits, signalling potential accumulation by smaller investors buying the dip.
While accumulation by retail traders might support prices, it’s also important to remember that technical analysis alone does not predict sudden market changes or news-driven volatility. Combining these indicators with broader market trends remains essential for decision-making.


