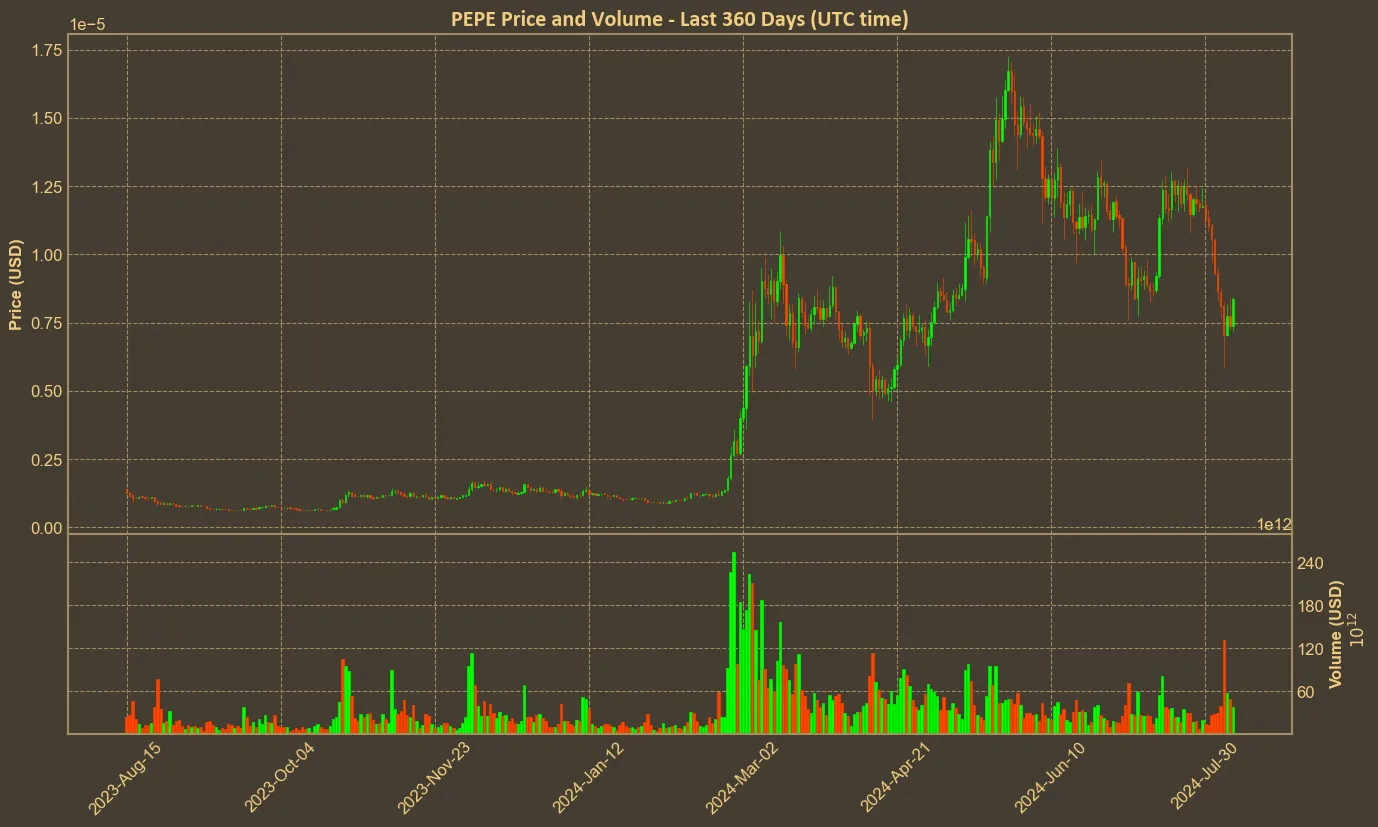
Pepe has been on the radar of many investors lately due to its phenomenal market movements. Currently holding the 24th position in the cryptocurrency market, Pepe’s recent performance showcases a blend of significant ups and downs. The early months of 2024 witnessed a drastic surge in Pepe’s value, much to the surprise of many market observers.
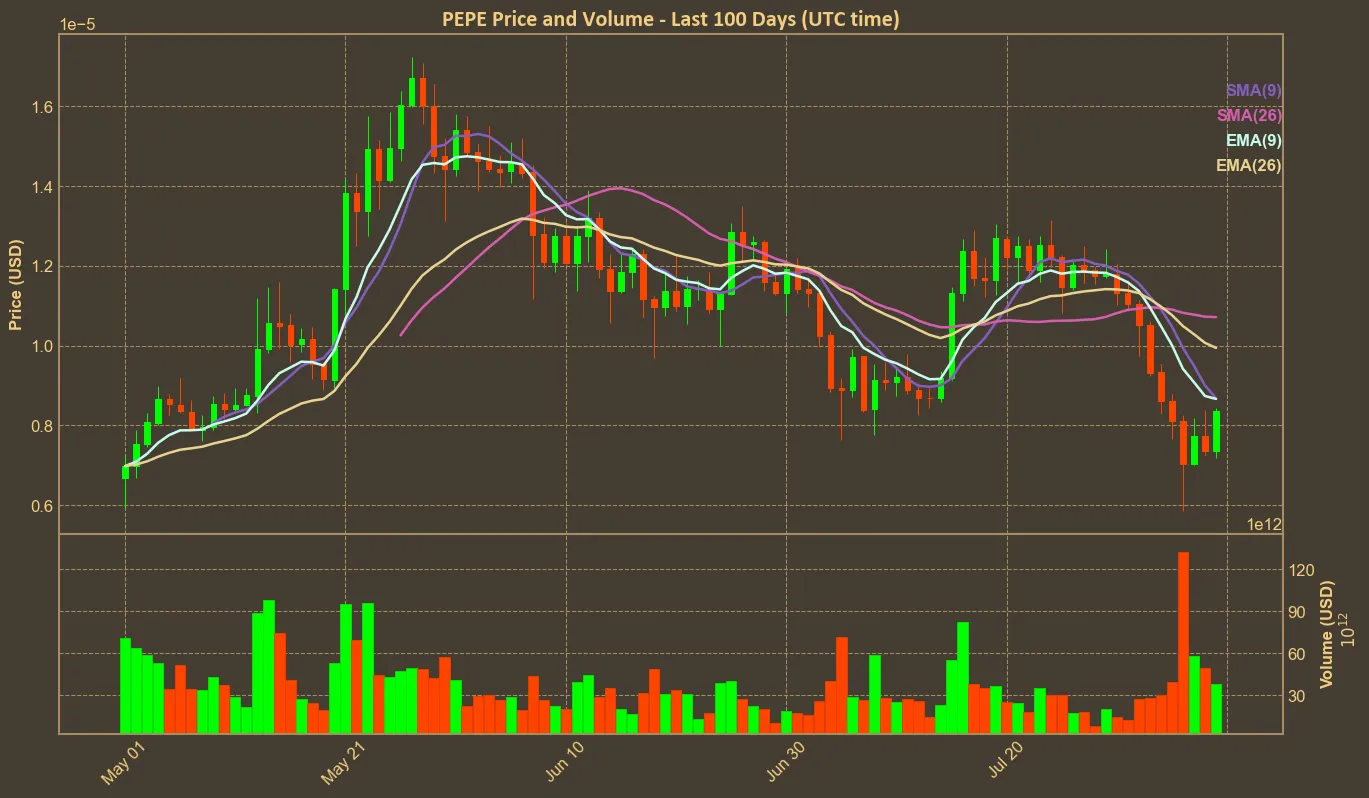
In the past day alone, Pepe’s price has risen by an impressive 11.24%, indicating a moment of recovery amidst a rather turbulent week. However, when we zoom out to observe its performance over the last week, the data tells a different story. The price declined by 18.09%, indicating considerable volatility. Over the past month, the decline has continued, showing an -8.39% drop. This recent dip is critical, especially when viewed against the backdrop of its remarkable annual growth of 583.34%.

The market cap of Pepe also reflects this volatility. While there has been a 3.11% increase in market cap over the last day, and an 8.09% rise over the last week, the monthly view depicts a decline of 8.16%. This fluctuation in market cap suggests that while there might be a short-term interest boost, long-term sentiments could be cautious.
Volume metrics provide additional insights. In the past day, volume increased marginally by 0.47%, but a glance at the week’s performance reveals a 18.78% decrease. Contrastingly, over the past month, the volume has soared by 44.52%, suggesting a resurgence of trading activity. This mixed pattern of volume changes indicates varying investor sentiments, possibly driven by periodic price swings and news around the coin.
Technical indicators like the Relative Strength Index (RSI) paint a compelling picture. The current RSI of 40 represents a bounce back from the oversold zone—it was 27 just three days ago—but it’s still below the neutral mark of 50, implying that the coin is neither overbought nor oversold. The recovery from the oversold levels might hint at an emerging buying interest or a temporary rebound post a significant downturn.
Other common technical indicators, such as the Simple Moving Average (SMA) and Exponential Moving Average (EMA), are currently neutral and provide no specific actionable insights. Indicators like MACD, AO, and others are also fairly flat, offering little predictive utility regarding the coin’s immediate future.

In my opinion, while Pepe has experienced considerable growth and intermittent recovery phases, this high volatility should not be ignored. It highlights the inherent uncertainty and risk present in the market. Investors should be mindful of these rapid swings and not base decisions solely on short-term performance.
It is essential to remember that technical analysis, while valuable, has its limitations. It does not account for sudden news events, regulatory changes, or broader economic factors that might sway the market. Therefore, a balanced approach that combines technical analysis with fundamental analysis and current news can provide a more comprehensive investment strategy.


