Polkadot has spent the last few weeks trying to stabilize after a rough quarter. Despite a modest monthly uptick, the coin is still down over 40% year-on-year and 33% in the last three months. At $4.18, the price sits just above key support levels, and recent attempts to build momentum haven’t led to anything conclusive.
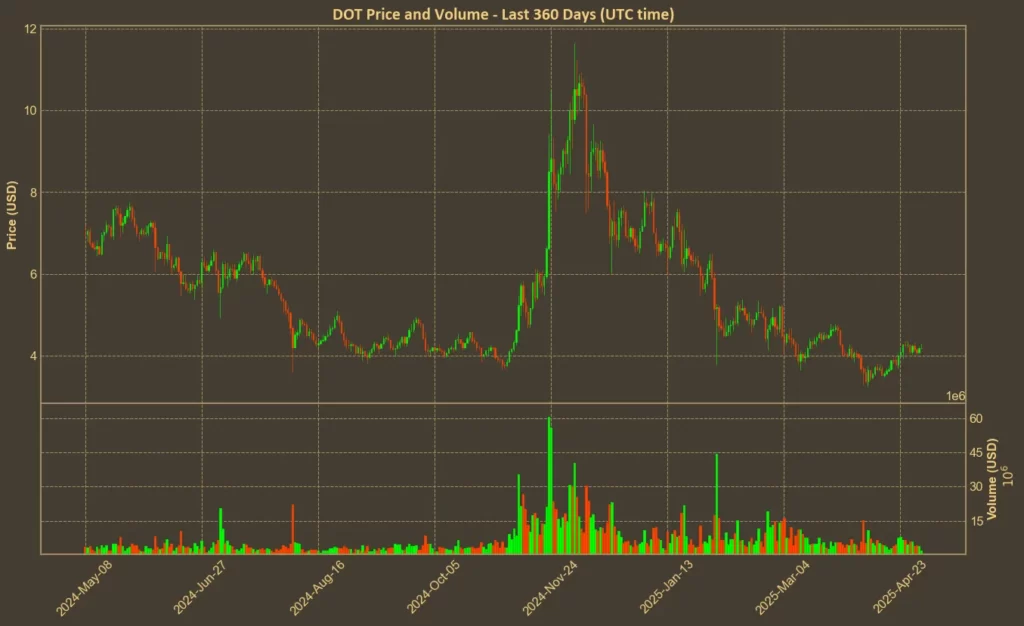
Volume is flat, price action is range-bound, and volatility is lower than average. But beneath the surface, some indicators show there’s still interest in DOT – at least in the short term.
Table of Contents
Click to Expand
Momentum Indicators
RSI: Neutral
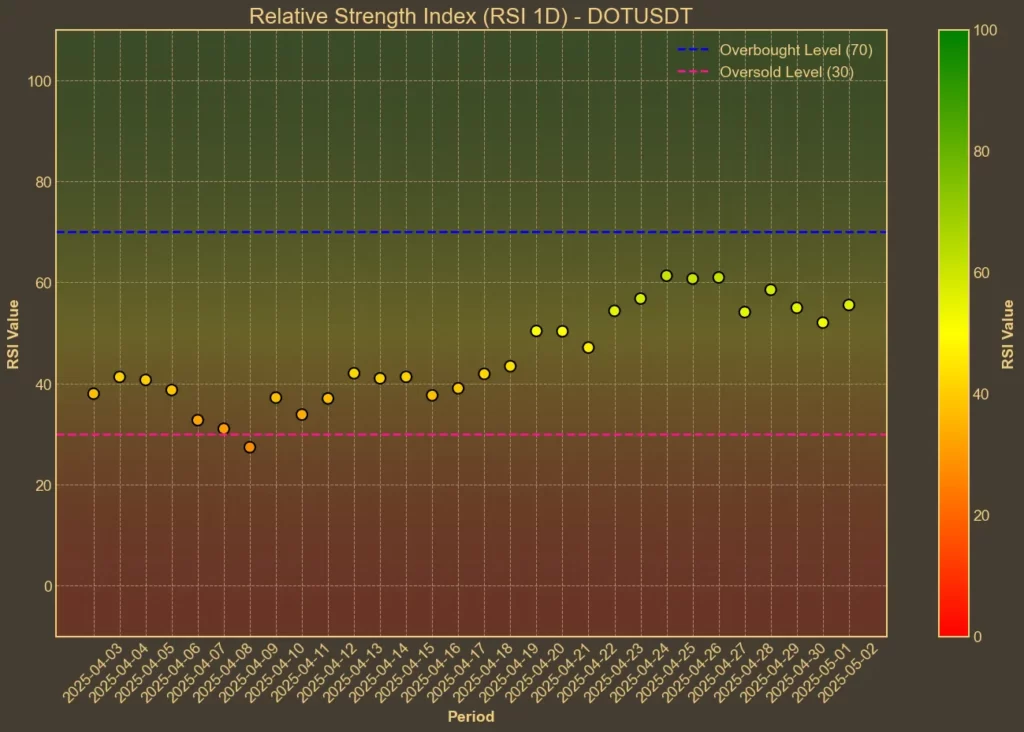
RSI measures how strong recent price changes are and whether the coin is overbought or oversold. DOT’s current RSI(14) is sitting at 56, the same as yesterday and slightly below last week’s 61. The short-term RSI(7) is hovering around 59. This puts the token in neutral territory – not showing immediate risk or excitement. That lines up with the sideways price action we’ve been seeing recently.
MFI: Overbought
The Money Flow Index adds volume to the equation and right now, MFI(14) is high at 73. That’s unchanged from yesterday but down from 82 last week. The high value suggests that capital has recently flowed into DOT at a strong pace. But because the price hasn’t followed with a sharp upward move, it raises the risk of a short-term pullback.
Fear & Greed Index: Greed
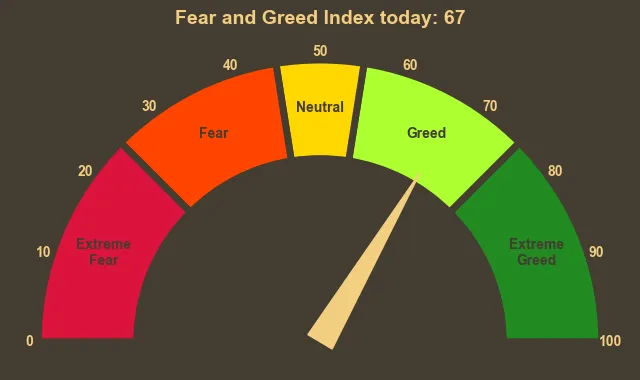
This index reflects overall crypto market sentiment. Today’s score of 67 signals clear greed, up from 53 just yesterday. The broader mood is optimistic, and DOT could benefit from this tailwind – but these sharp mood shifts can flip quickly if macro news sours.
Moving Averages
SMA & EMA: Slightly Bullish
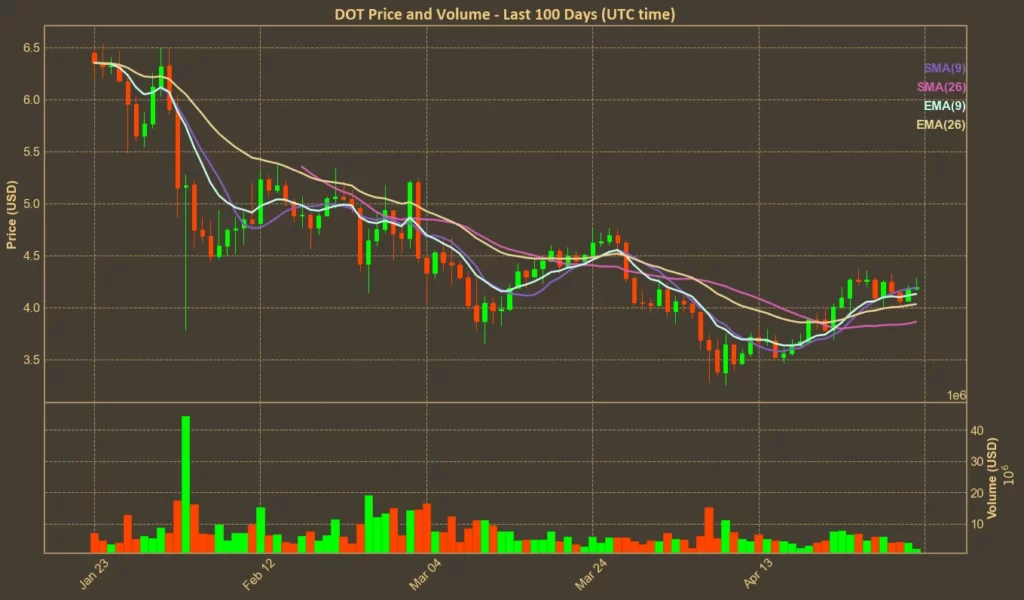
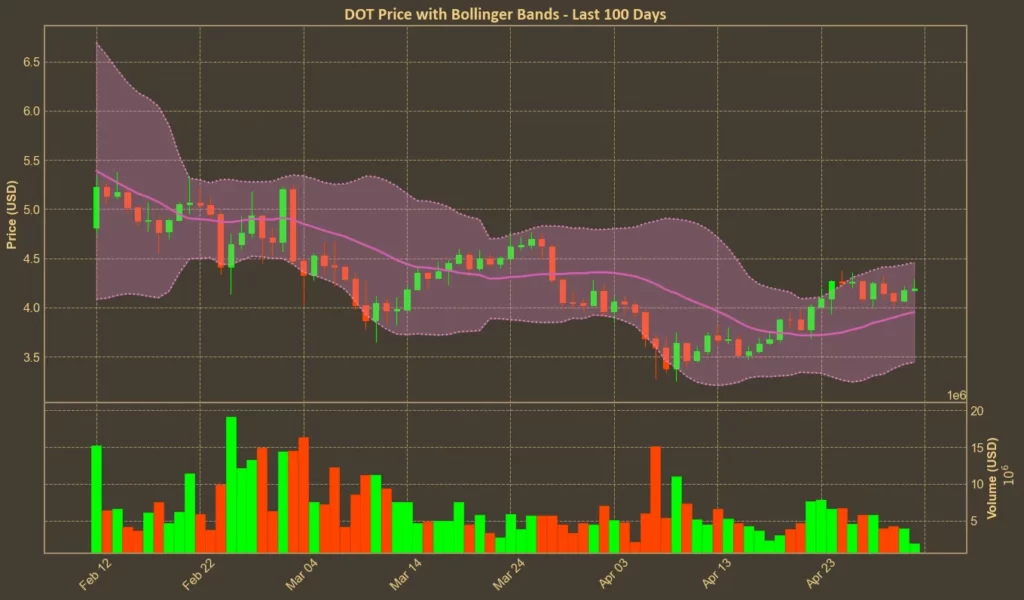
DOT’s short-term averages are encouraging. The current SMA(9) is slightly above the current price at 4.19, and the EMA(9) sits just below at 4.13. The 26-day averages show a similar structure – SMA(26) is 3.86, EMA(26) is 4.03. This setup supports a cautious bullish view for now. If price holds or moves slightly up, this structure could attract more short-term traders.
Bollinger Bands: Increased Volatility
The upper Bollinger Band is at 4.46 and the lower at 3.45 – a wide gap that reflects growing volatility. DOT is now closer to the upper band than the lower, hinting at temporary overbought conditions. This could either mean momentum is building – or that a cooldown is likely before the next move.
Trend & Volatility Indicators
ADX: Weak Trend
The ADX reading has fallen to 15, down from 23 a week ago. That’s a low number, signaling that any existing trend lacks strength. It confirms what the price chart already shows – the recent move up is real, but not yet strong enough to be called a trend.
ATR: Lower Volatility
ATR has dropped slightly to 0.22, down from 0.24 a week ago. This is consistent with the slow and indecisive price action. Volatility is falling, and so far, there’s no breakout in either direction.
AO: Bullish
The Awesome Oscillator shows a positive value of 0.27 – up from 0.09 a week ago. That’s a bullish development and signals rising short-term momentum. But without support from other trend indicators, it doesn’t guarantee anything more than a bounce attempt.
VWAP: Bearish
VWAP is sitting at 4.60 – above the current price. This suggests that DOT is trading below its average weighted by volume, which is typically seen as a bearish sign. Until the price moves above VWAP, confidence in a sustainable recovery remains limited.
Relative Performance
Comparison Against ETH: Weak
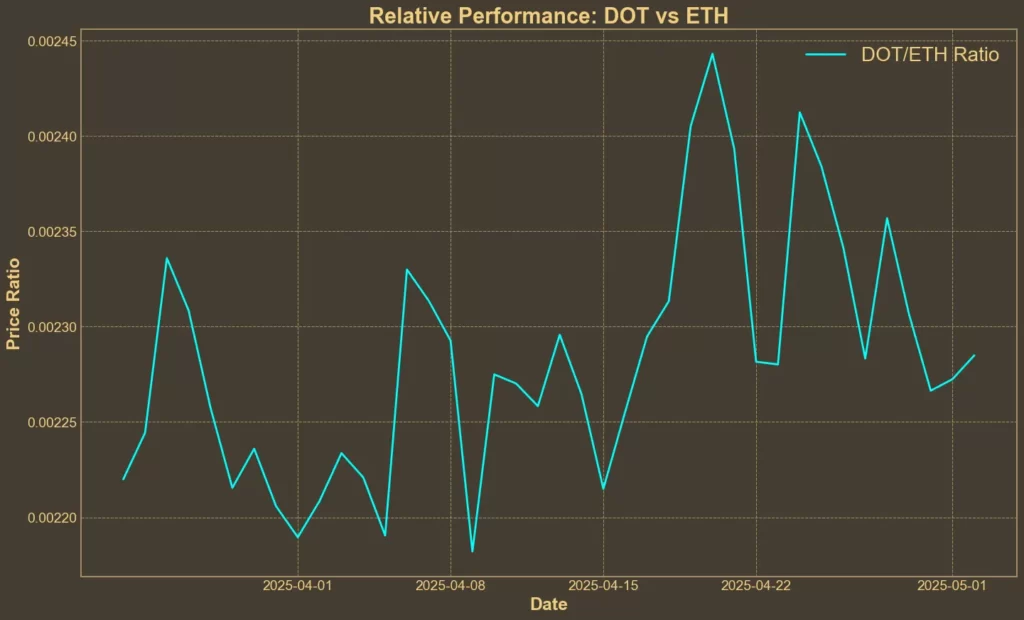
The DOT/ETH ratio has dropped over 4% in the last week, though it’s up slightly over the month. But the weekly direction matters more – and right now, DOT is underperforming. This relative weakness might limit upside unless the broader market shifts.
Final Thoughts
On the surface, DOT appears to be stabilizing. Indicators like the RSI and short-term moving averages suggest calm conditions, while MFI and AO point to some buying interest. But deeper trend signals like ADX and VWAP show hesitation. The trend is weak, and DOT is still trading below where most buyers entered.
The recent price movement could turn into something stronger – especially if the broader crypto market continues pushing higher. But for now, this is still a reaction to a long decline, not a reversal.
Read more: Polkadot Spends $400K on Marketing at Token 2049: Worth It?


