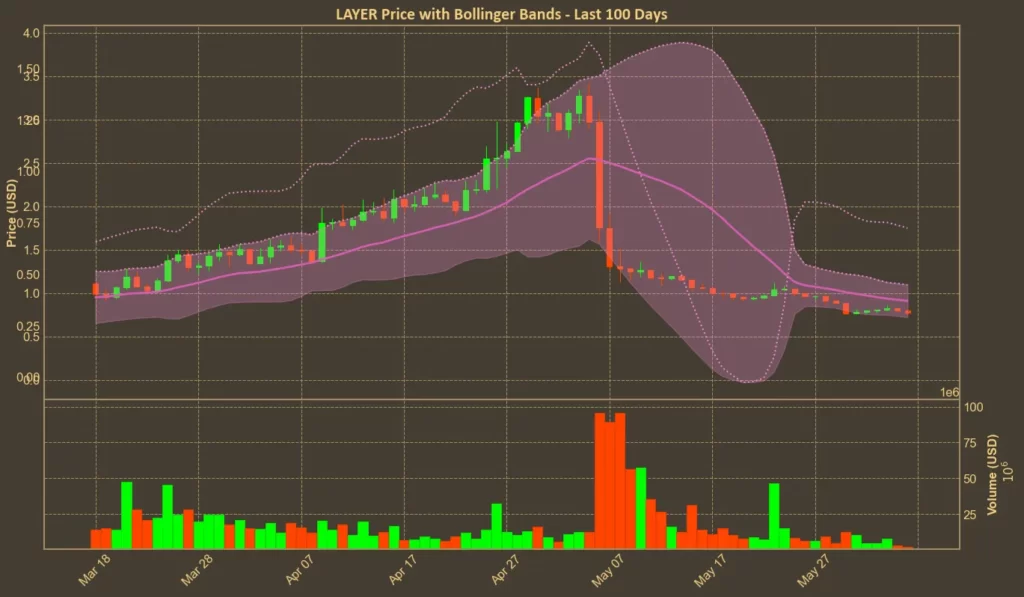
It’s now been almost a full month since Solayer (LAYER) crashed 30% in one day – and things have only gotten worse. Today the token is trading below $0.80, marking a 70% drop from its May 5 high and wiping out nearly all of the gains from its explosive April rally. Despite ongoing product updates and a second season of ecosystem incentives, the market has shown no real interest in returning.
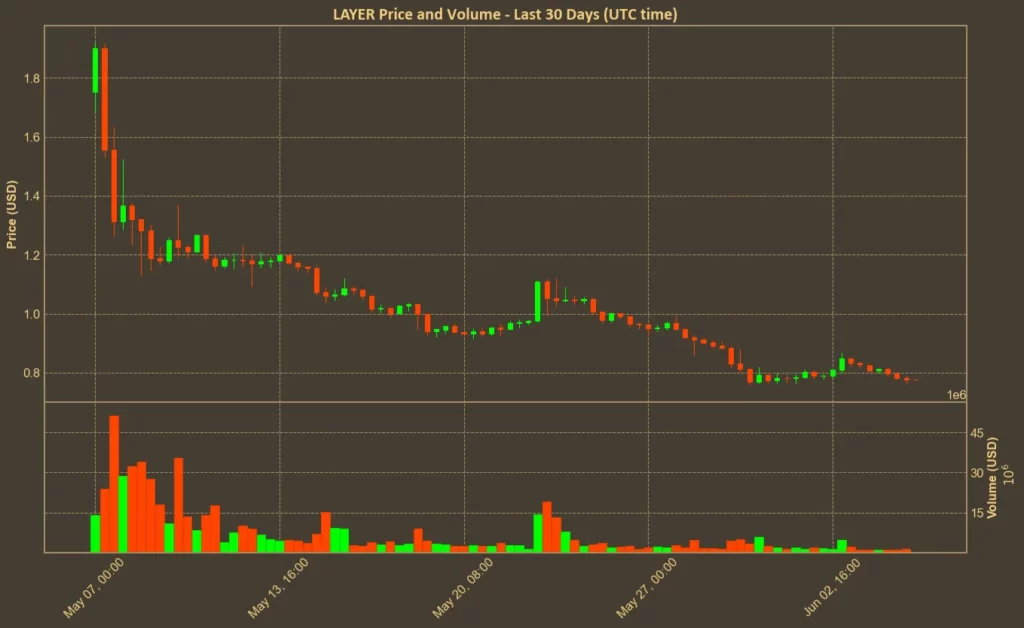
The fall hasn’t been sudden this time – it’s been steady and quiet. The April breakout is now a distant memory, and the data behind the chart tells a clear story: momentum is gone, trend strength is weakening, and buyers are sitting out.
Table of Contents
Click to Expand
Momentum Indicators
RSI: Oversold
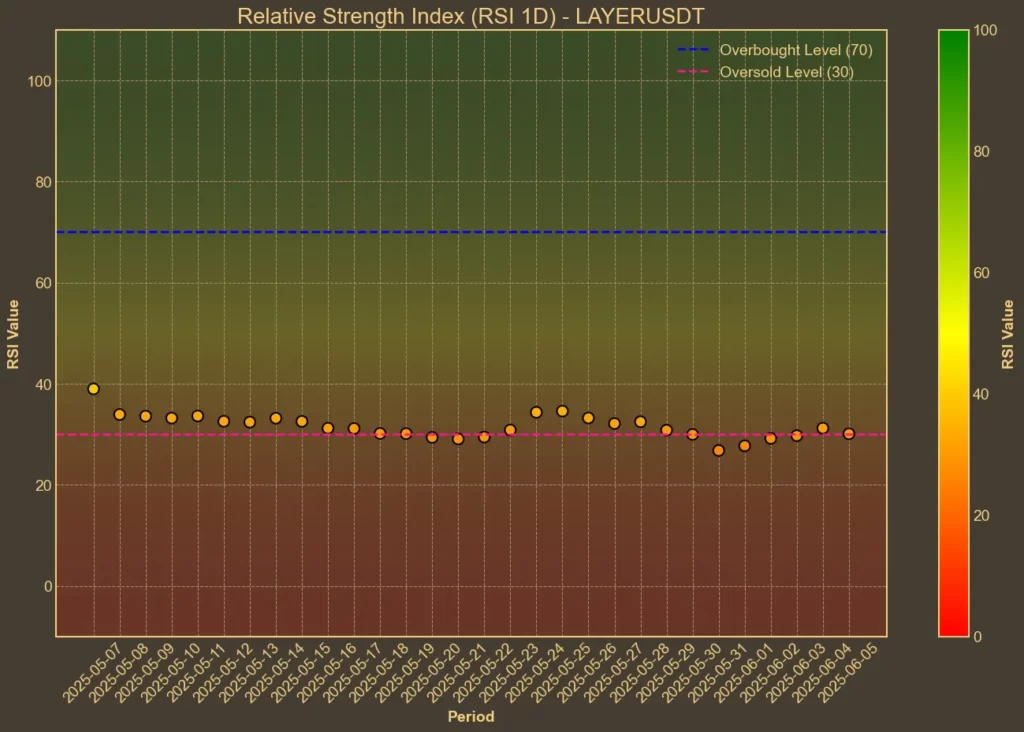
The Relative Strength Index (RSI) shows a market that’s oversold and stuck there. RSI(14) sits at 29, barely changed from last week. Short-term RSI(7) is even lower, suggesting that buyers still haven’t stepped in. Usually, this would signal a potential bounce – but without volume or demand, it’s more of a warning than an opportunity.
MFI: Neutral
The Money Flow Index has flattened. MFI(14) at 58 doesn’t suggest accumulation or panic. That might seem like a good thing, but in context, it reflects a disinterested market. After such a sharp drop, a flat MFI points to apathy more than strength.
Fear & Greed Index: Neutral
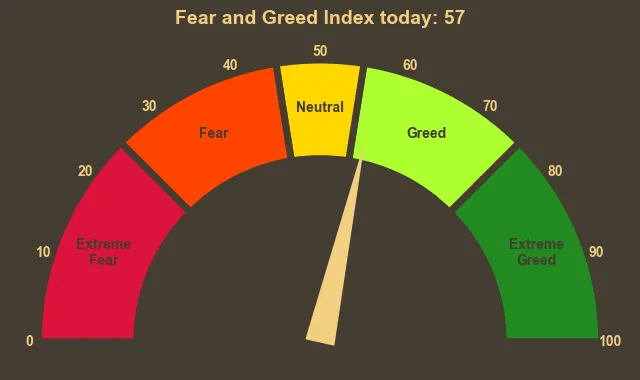
The broader crypto sentiment has cooled off, but still leans positive. The Fear and Greed Index has fallen from 74 to 57 in a week, showing increasing caution. It spills over into all cryptocurrencies, and low-confidence tokens like LAYER might feel it first.
Moving Averages
SMA & EMA: Bearish
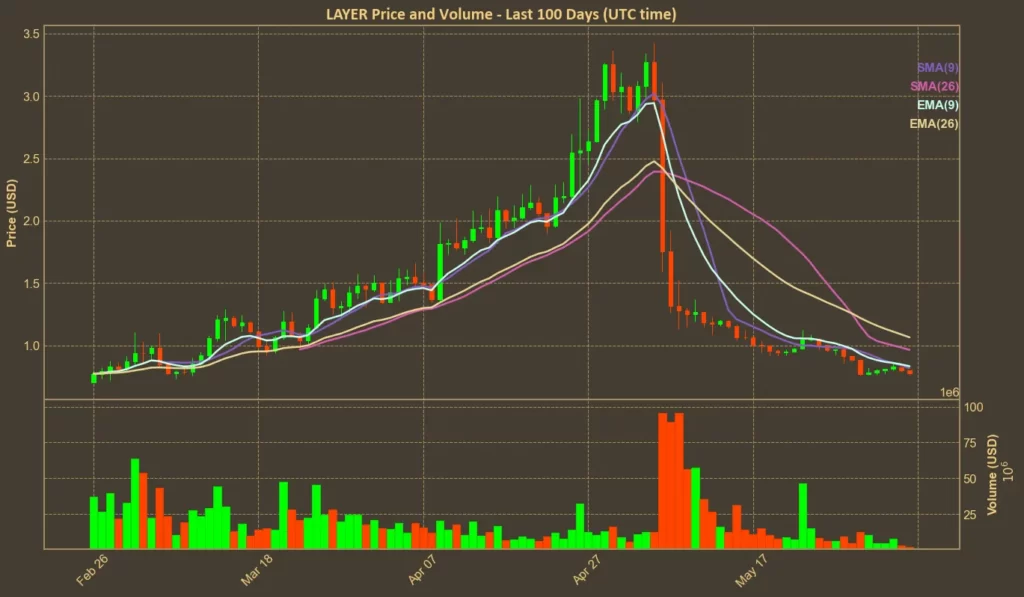
Short-term moving averages continue to drift lower. With the SMA(9) at 0.81 and EMA(9) at 0.83, the current price of LAYER is clearly below both. Longer averages like EMA(26) are still high at 1.06, highlighting how far the token has fallen.
Bollinger Bands: Bearish
Bollinger Bands have tightened. That usually means volatility is decreasing – but with price hugging the lower band, the next move could be another leg down. Without a bounce or volume spike, the risk of a breakdown remains high.
Trend & Volatility Indicators
ADX: Weakening Trend
ADX(14) remains at 32. That means the trend is still there – but it’s no longer strengthening. Momentum is fading, and if that continues, LAYER may enter a long period of sideways drift at low levels.
ATR: Low Volatility
Volatility is collapsing. ATR(14) has dropped from 0.15 to 0.11, which confirms what the chart shows – price is moving less, and interest is evaporating. A quiet market after a crash rarely ends in recovery unless something changes.
AO: Still Bearish
The Awesome Oscillator is negative. It’s moved slightly up from -0.72 to -0.44 over the past week, but still below zero. That confirms the bearish momentum is not over.
VWAP: Bearish
The VWAP sits far above current price, at 1.34. That gap means most positions opened in the last two months are underwater. With no signs of volume returning, there’s no incentive for traders to reenter here.
Relative Performance
Comparison Against SOL: Very Weak
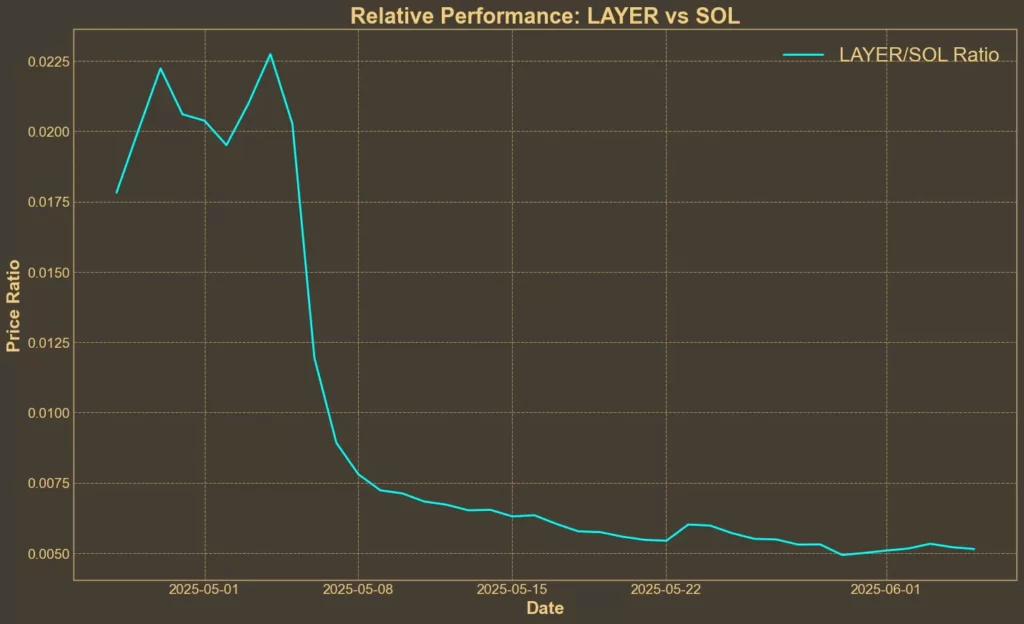
The LAYER/SOL ratio is down nearly 75% over the last month. Compared to Solana, Solayer isn’t just underperforming – it’s falling apart. In a month where most major cryptocurrencies have gained ground, LAYER has done the opposite.
Conclusion
The technicals match the sentiment. Oversold RSI, compressed bands, falling averages – all of it points to a chart with no momentum and little confidence. Price has found temporary support, but there’s no sign of strength behind it.


