After weeks of mixed signals, Stellar has shown some signs of strength. The price of XLM is up more than 30% in the last month, reversing a longer-term downward trend and pushing the coin back into conversation. The market cap has recovered in parallel, and daily volume surged earlier in the month – although it’s now fading. But price action alone doesn’t give the full picture. The latest technical indicators give a more nuanced view.
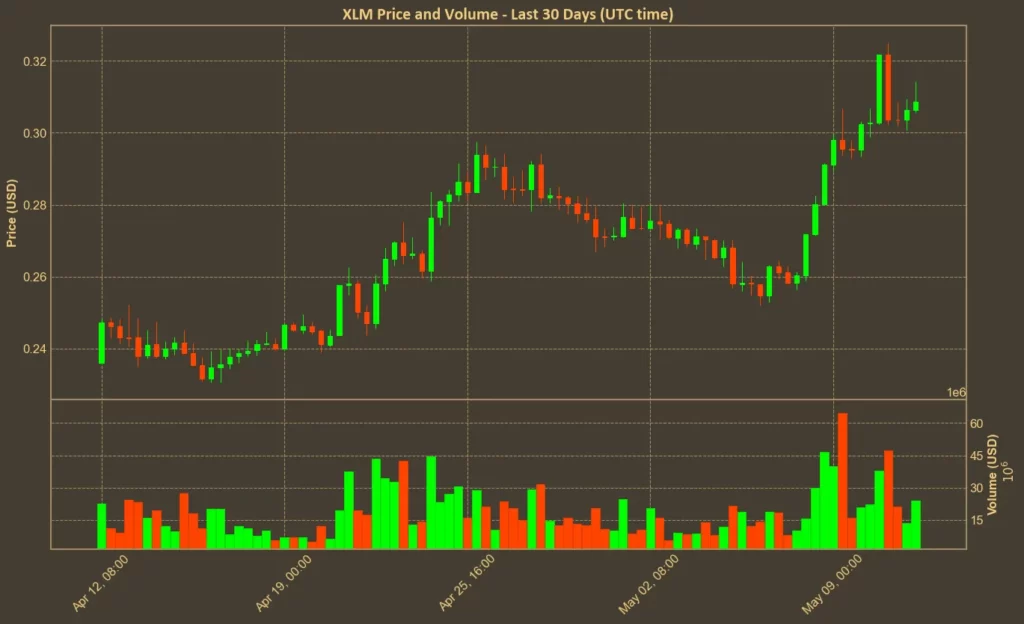
Table of Contents
Click to Expand
Momentum Indicators
RSI: Close to Overbought
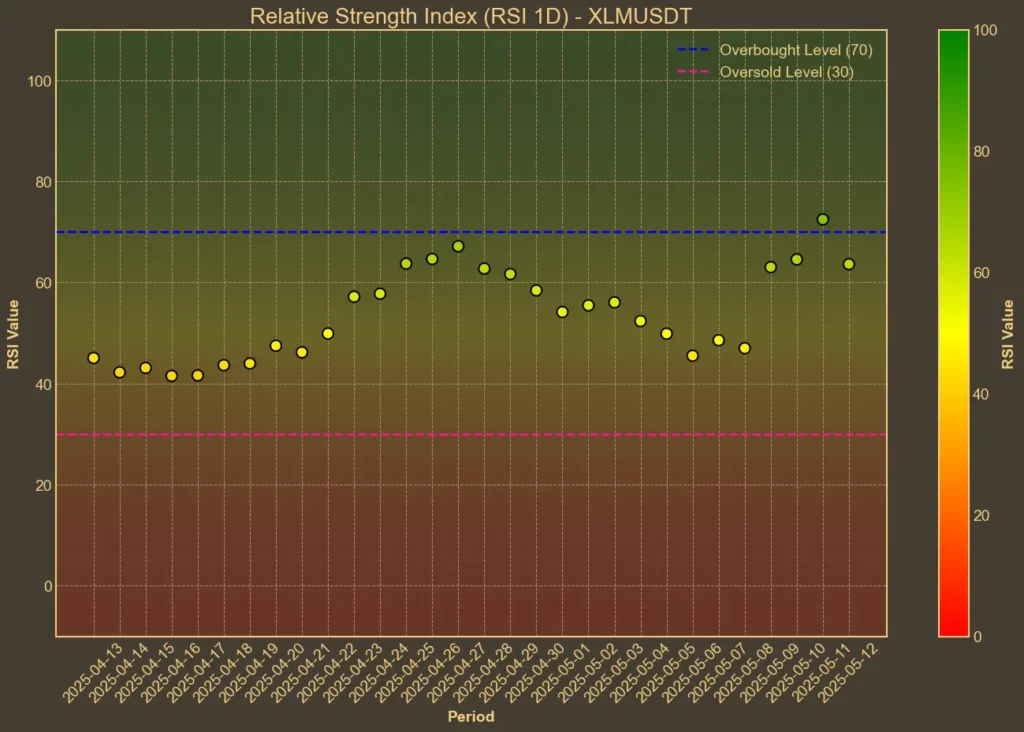
The Relative Strength Index (RSI) is approaching levels that often suggest a pullback. The 14-day RSI sits at 64, with the 7-day version slightly higher at 68. A week ago, the 14-day RSI was 46 – so this is a sharp move in a short time. The market is heating up fast, and this could mean short-term overextension.
MFI: Neutral
The Money Flow Index, which factors in both price and volume, gives a more balanced read. At 56 today, it’s up from 52 yesterday but still below last week’s 60. This suggests that although price is moving up, the inflows of capital may not be keeping pace – or at least not accelerating further.
Fear & Greed Index: Greed
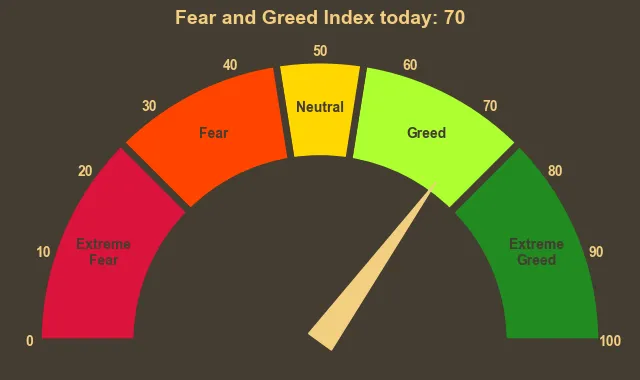
Market sentiment has shifted. The Fear & Greed Index hit 70 for three consecutive days. A week ago it was at 52, and just a few days before that it was down in the 50s and 60s. This confirms what the RSI already hinted at – we’re closer to optimism than caution right now.
Moving Averages
SMA & EMA: Bullish
Both short and mid-term averages are supporting the price. The current price is above the 9-day and 26-day moving averages. That’s a positive signal, especially with the 9-day SMA and EMA both climbing. The short-term trend is strong, and price action is confirming it for now.

Bollinger Bands: Increased Volatility
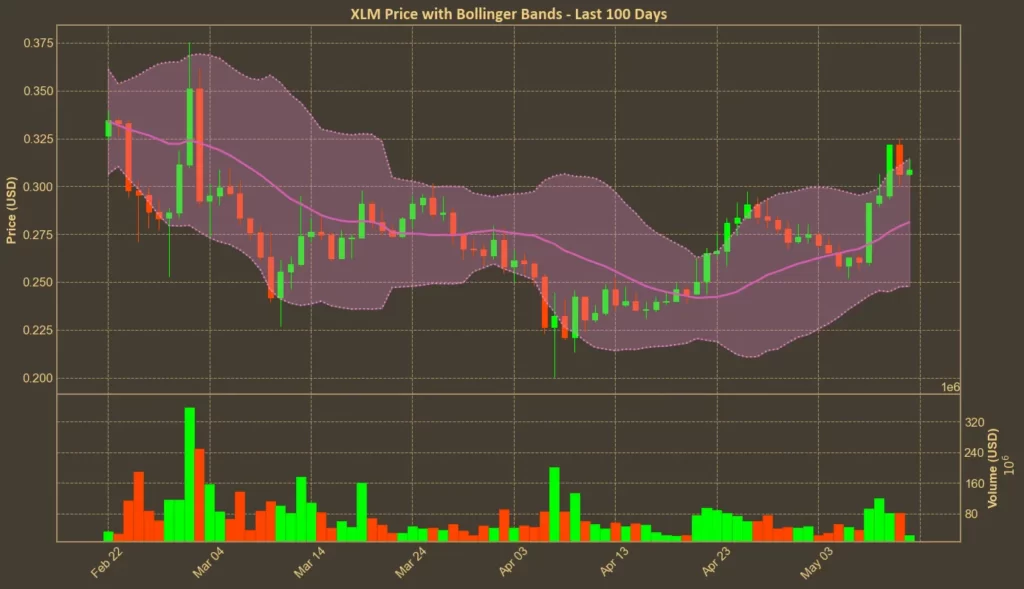
The price is trading near the upper Bollinger Band, which now stands at $0.3147. The lower band sits far below at $0.2478. This setup usually means higher volatility, and the price being near the upper edge could indicate short-term exhaustion – or it could lead to a breakout, depending on follow-up volume.
Trend & Volatility Indicators
ADX: Strengthening
The Average Directional Index is up to 25 from 19 last week. Anything over 20 starts to confirm that a trend is forming, and this shift suggests a growing momentum behind the recent rally.
ATR: Stable Volatility
The Average True Range is steady at 0.016, close to last week’s level. This means that while the price has been moving up, the daily swings are not increasing significantly. It supports the idea that the rally is steady, not wild.
AO: Bullish
The Awesome Oscillator has been rising every day. Today’s reading of 0.0362 is more than double last week’s 0.015. This confirms growing momentum behind the upward move.
VWAP: Slightly Bullish
VWAP sits at $0.3004, slightly below the current price. This reinforces the idea that current price levels are supported by recent volume – a good sign for short-term stability.
Relative performance
Comparison Against XRP: Bullish
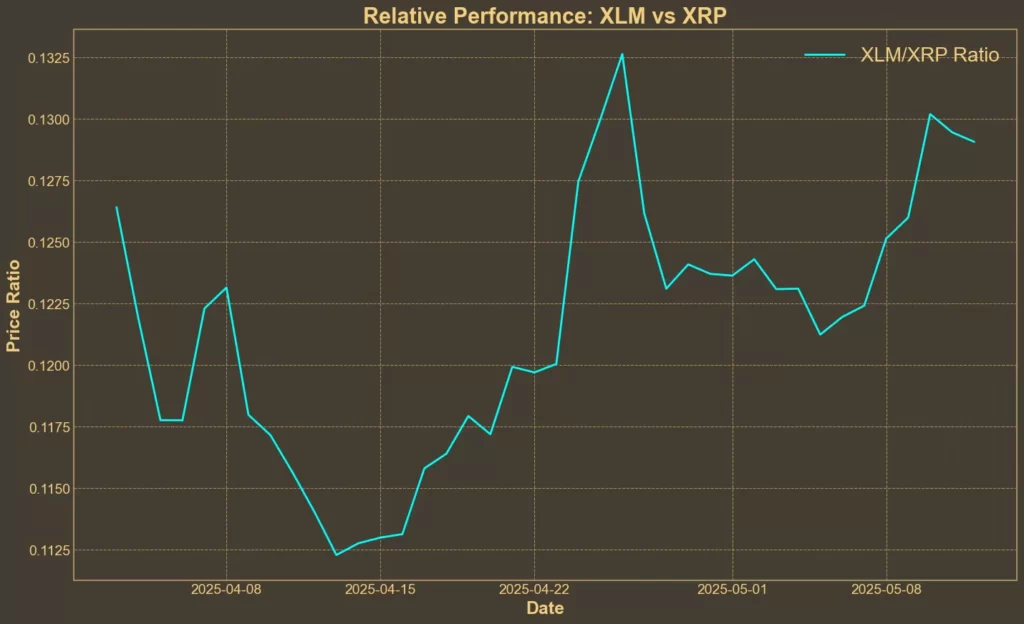
The XLM/XRP ratio has risen more than 15% over the past month and 6.6% just in the last seven days. It’s not just that XLM is gaining in dollar terms – it’s also outperforming peers. That’s one of the strongest relative signals we’ve seen from Stellar in a while.
Summary
Technical analysis confirms that the recent rally in Stellar is more than just noise. Key indicators suggest growing momentum, supportive volume, and improving sentiment. But this doesn’t mean the trend is guaranteed to continue. RSI and Bollinger Bands are both flashing caution signs, and volume has been falling over the past week.
If XLM holds above its short-term moving averages and manages to push through resistance without getting rejected near the upper Bollinger Band, the case for a sustained uptrend gets stronger. But if volume keeps falling, it could just as easily drift back down.
Read also: 5 Coins Leading the Way in Ultra-Low Transaction Fees

