After a strong upward run through early April, Sui is starting to show signs of fatigue. The coin surged over 50% in the past month, driven in part by ETF speculation and rising activity in its ecosystem. But over the past week, price action has flipped, and momentum indicators now suggest that Sui might be in for a cooldown.
The token briefly pushed above $3.50 last week, but failed to stay there. Now, after dropping more than 6% in the past day, it’s back around $3.20 – and the charts are showing weakness.
Table of Contents
Click to Expand
Momentum Indicators
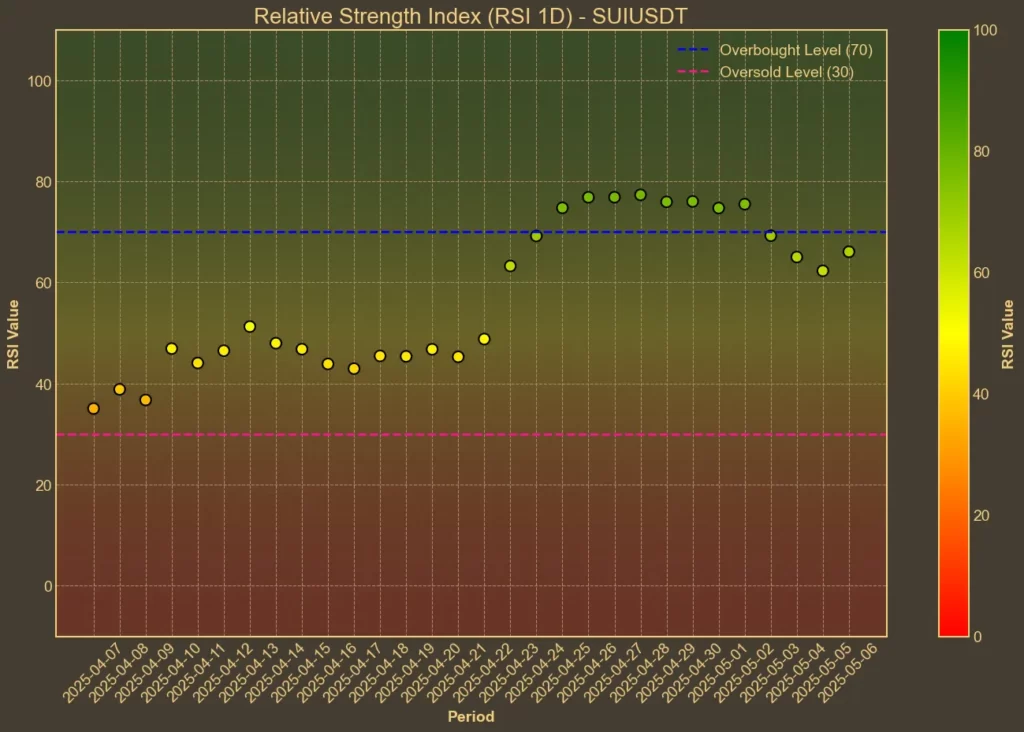
RSI: Neutral
The RSI is pointing to slowing momentum. The 14-day reading has fallen from 76 last week to 58 now. That means the coin is no longer in the overbought zone, but it’s also not showing clear strength. The short-term RSI(7) dropped sharply from 64 to 47 in just 24 hours. That’s a red flag, as it shows the pullback isn’t just noise – it’s cutting into the short-term trend.

MFI: Neutral
Money Flow Index is following a similar path to RSI. After peaking at 81 a week ago, it’s now down to 65. That drop signals that buyers are stepping back, and volume-weighted buying pressure is cooling. The MFI still isn’t bearish, but it no longer shows strong inflows.
Fear & Greed Index: Greed
Across the broader crypto market, sentiment is shifting quickly. The Fear & Greed index rose to 67 earlier in the week but has since slid to 59. It’s still in “greed” territory, but trending lower day by day. That fits with what we’re seeing in Sui: interest hasn’t vanished, but it’s starting to fade.

Read also: How To Use Crypto Fear and Greed Index To Your Advantage?
Moving Averages
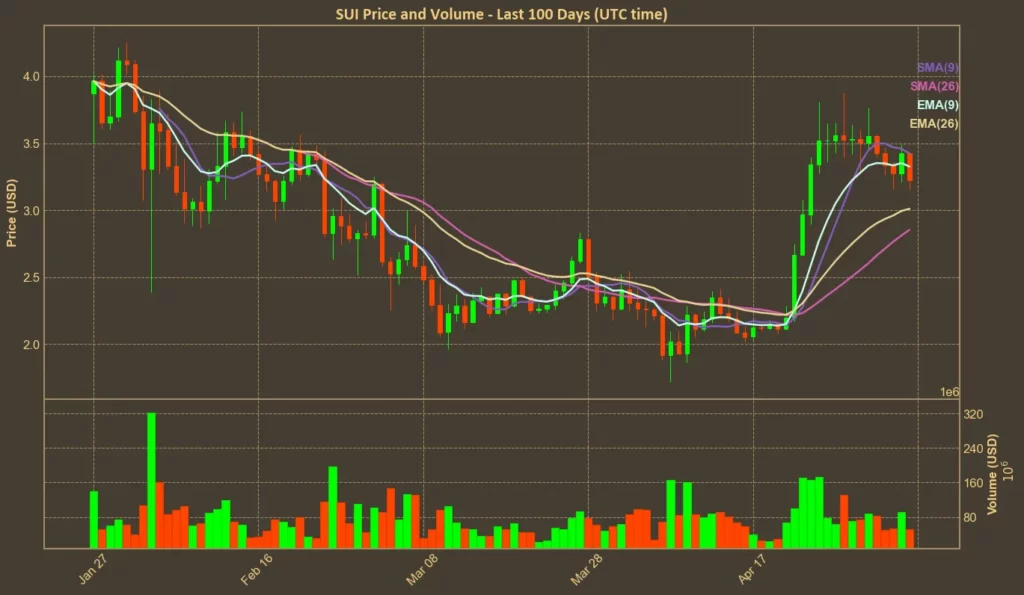
SMA & EMA: Bullish
Sui is still trading above both short- and medium-term moving averages, which typically supports a bullish view. The SMA(9) sits at $3.42 and EMA(9) at $3.33 – both higher than the current price, but only slightly. The longer-term SMA(26) at $2.85 and EMA(26) at $3.01 are still well below, so there’s a technical buffer. But if price slips much further, this support could flip into resistance quickly.

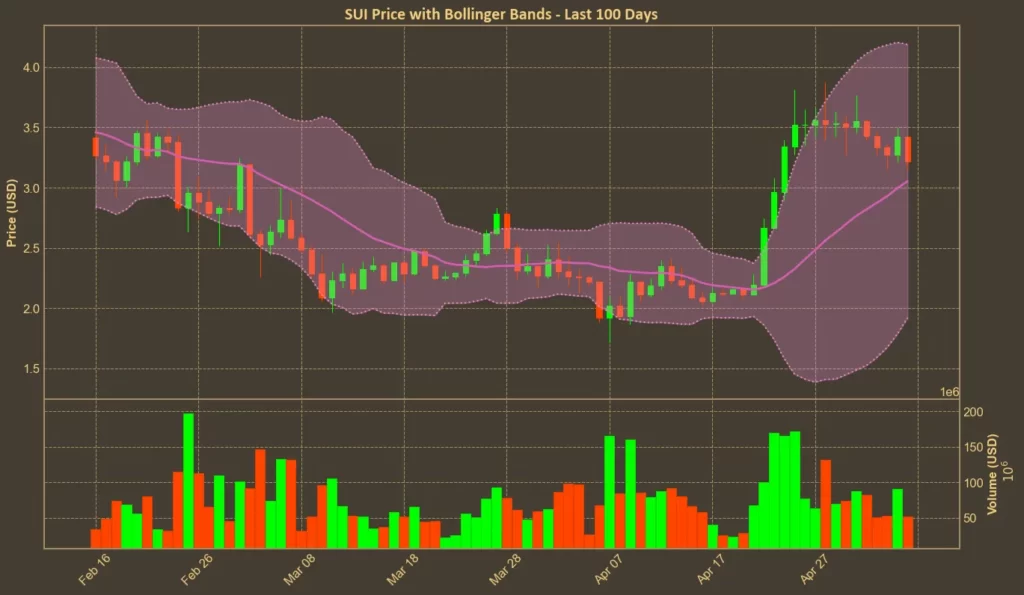
Bollinger Bands: Increased Volatility
Sui touched the upper Bollinger Band near $4.19 last week but reversed quickly. The price is now closer to the middle of the range, moving downward. With the lower band at $1.92, there’s room for more downside if current support fails. The wide gap between the bands also signals heightened volatility – not stability.

Trend & Volatility Indicators
ATR: Stable Volatility
ATR is holding around 0.27, down slightly from last week. That means volatility is not accelerating, which is somewhat reassuring. But it also suggests that the most intense part of the move might already be over.
AO: Bullish, But Fading
Awesome Oscillator has declined from 1.07 a week ago to 0.67 now. That confirms the fading bullish momentum, with fewer high-momentum green candles appearing on the chart.
VWAP: Slightly Bearish
Today’s VWAP sits at 2.89 – below the current price. That’s a sign the market might be slightly overvalued in intraday terms. Buyers pushing price above VWAP without support might be doing so on thin volume or short-term trades.
Relative Performance
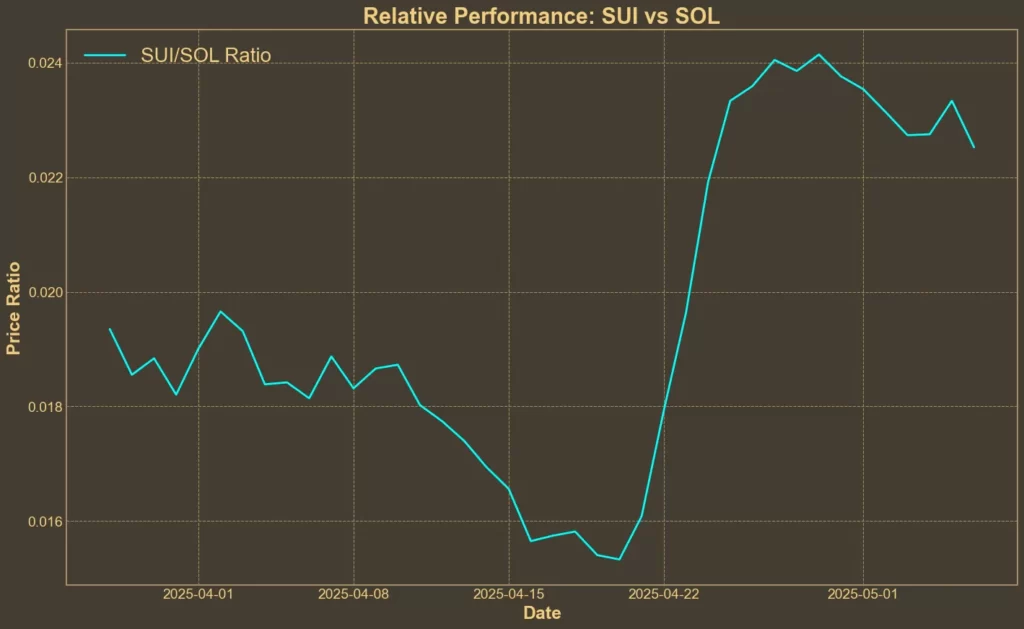
Comparison Against SOL: Short-Term Weakness
SUI/SOL ratio has dropped nearly 7% in the past week. That’s not just noise – it shows Sui is underperforming even against Solana. However, the ratio is still up nearly 20% in the monthly window.

Summary
Sui had a strong month, but the rally is showing signs of stress. Most of the indicators point to weakening momentum, lower demand, and higher risk of further pullback. Moving averages still offer some technical support, but if the price dips much more, that could change fast.
As always, remember that while technical analysis can help spot signals, it doesn’t predict news, sentiment shifts, or black swan events. Sui still has long-term potential, but the current setup is tilted toward consolidation or short-term decline rather than a fresh breakout.
Read also: RSI: The Beginner’s Tool That Most People Use Wrong


