After a strong performance earlier this year, SUI’s momentum has clearly slowed. The token is still sitting at a $3.34, but recent price action has turned sideways to slightly bearish. While Sui is up over 230% year-on-year and gained more than 50% last quarter, the last 30 days tell a different story. The price is down over 14%, and recent intraday movements have failed to break out of the short-term resistance zone near $3.50. Spot volume is cooling, and market cap has been sliding along with it.
It’s not a collapse – far from it. But the bullish energy that pushed the token earlier seems to have faded for now.
Table of Contents
Click to Expand
Momentum Indicators
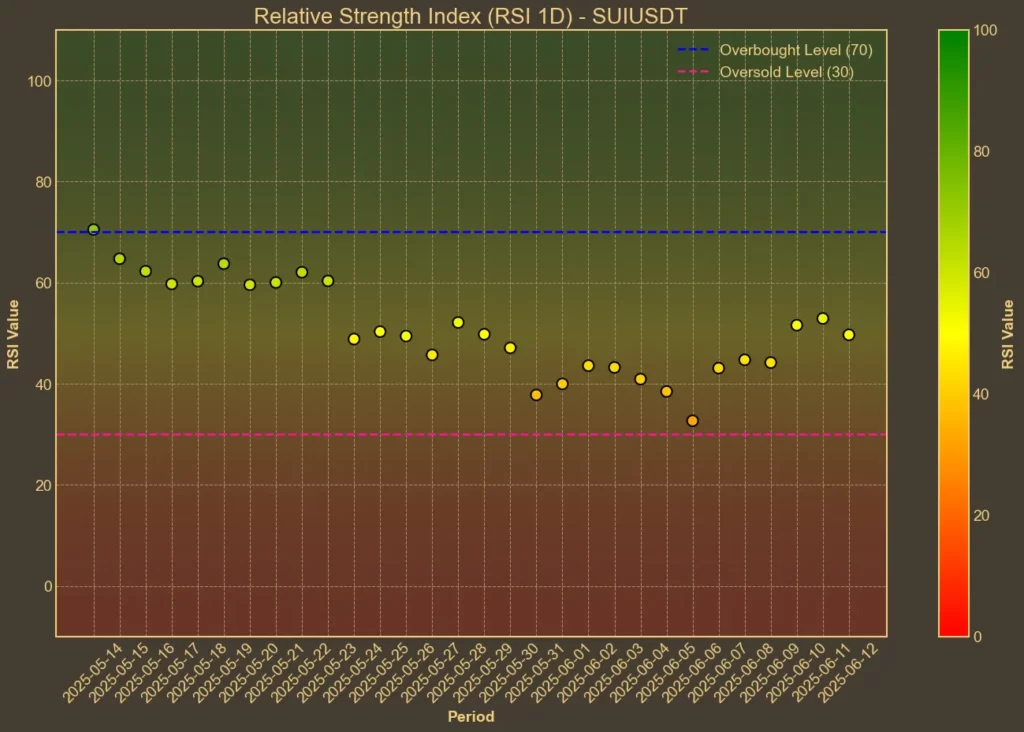
RSI: Neutral
RSI, which tracks overbought or oversold conditions, is hovering around 48 on the 14-day setting – right in the middle. Shorter-term RSI(7) also cooled to 49 from 53 just yesterday. That suggests the buying pressure is no longer dominant, but it hasn’t flipped into clear selling momentum either. It’s a pause – not yet a trend change.
MFI: Neutral
The Money Flow Index confirms the same cooling trend. MFI(14) is sitting at 40, a slight rise from yesterday but well below the highs seen earlier in the month. Last week it was as low as 24, so there has been some recovery, but volume-backed momentum isn’t strong. Buying interest has returned, but it’s not accelerating.
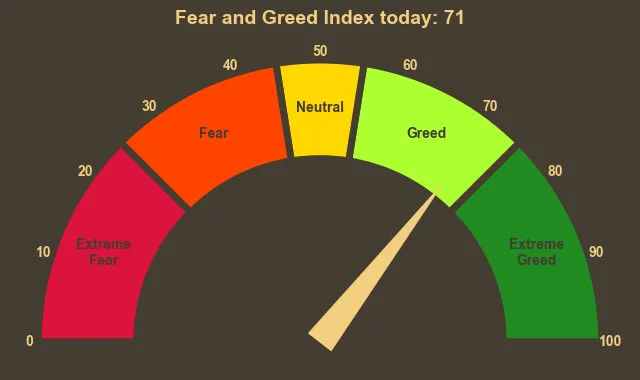
Fear & Greed Index: Greed
The broader crypto market is still showing high greed levels. The Fear & Greed Index currently sits at 71. While this isn’t specific to SUI, it reflects a market that’s still biased toward risk-taking – which can support bullish setups, even if the individual coin looks stalled.
Moving Averages
SMA & EMA: Mixed
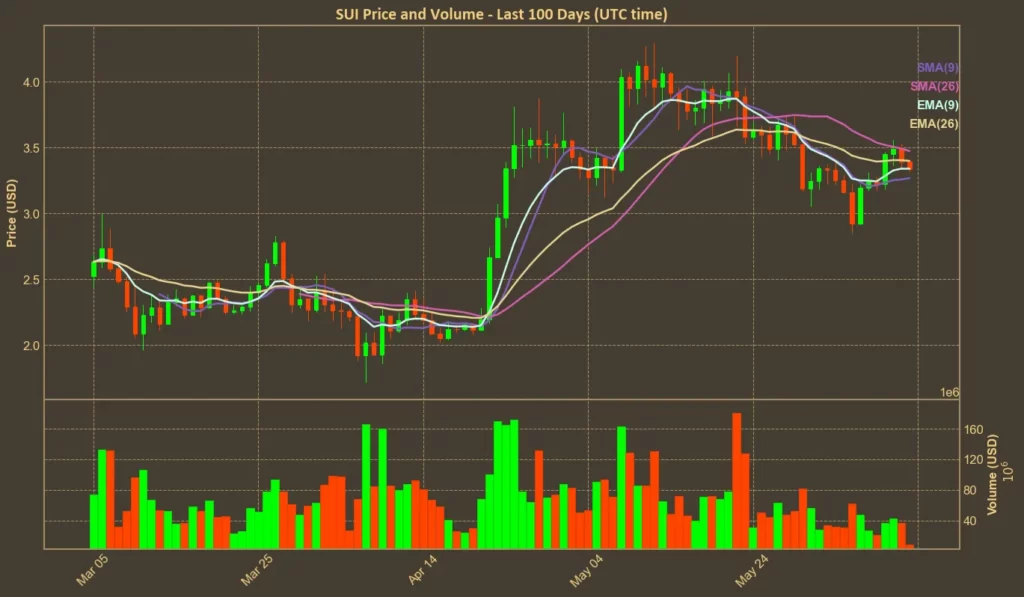
The fast-moving averages are hovering around the current price, while the slower ones remain above it. SMA(9) is at $3.27 and EMA(9) aligns with the price at $3.34. But SMA(26) and EMA(26) are both higher, at $3.47 and $3.40 respectively. This usually signals hesitation – the short-term view is undecided, and the longer-term trend has not been reclaimed yet.
Bollinger Bands: Increased Volatility
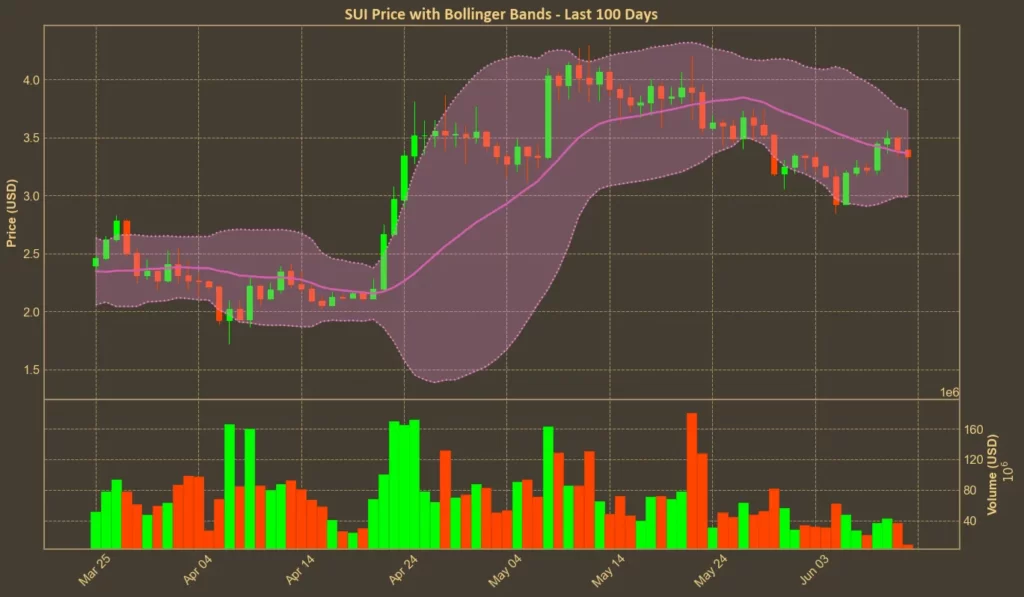
The Bollinger Bands are now wide, with the upper band at $3.74 and the lower at $2.99. Price is currently in the middle. This suggests SUI is neither overheated nor deeply sold, but the recent expansion of the bands shows a volatility increase – usually a precursor to stronger moves. Which direction remains unclear.
Trend & Volatility Indicators
ADX: Weak Trend
The Average Directional Index is at 21, down from 24 a week ago. That’s a sign that SUI is lacking a strong trend, whether up or down. Traders are still unsure if the rally can resume or if further correction is ahead.
ATR: Cooling Volatility
ATR(14) has dropped from 0.27 to 0.23 over the past week. That confirms the recent decrease in price swings.
AO: Bearish, But Improving
The Awesome Oscillator remains negative at -0.22. It’s an improvement from -0.39 a week ago, but it hasn’t flipped to green yet. This is typically a lagging indicator, but the direction matters – and right now, the signal is weak bearish momentum.
VWAP: Slightly Bullish
SUI’s price is above the VWAP, which currently sits at $2.98. That’s a mild bullish indicator, suggesting the average buyer is still in profit. However, the gap isn’t large enough to signal aggressive buying interest.
Relative Performance
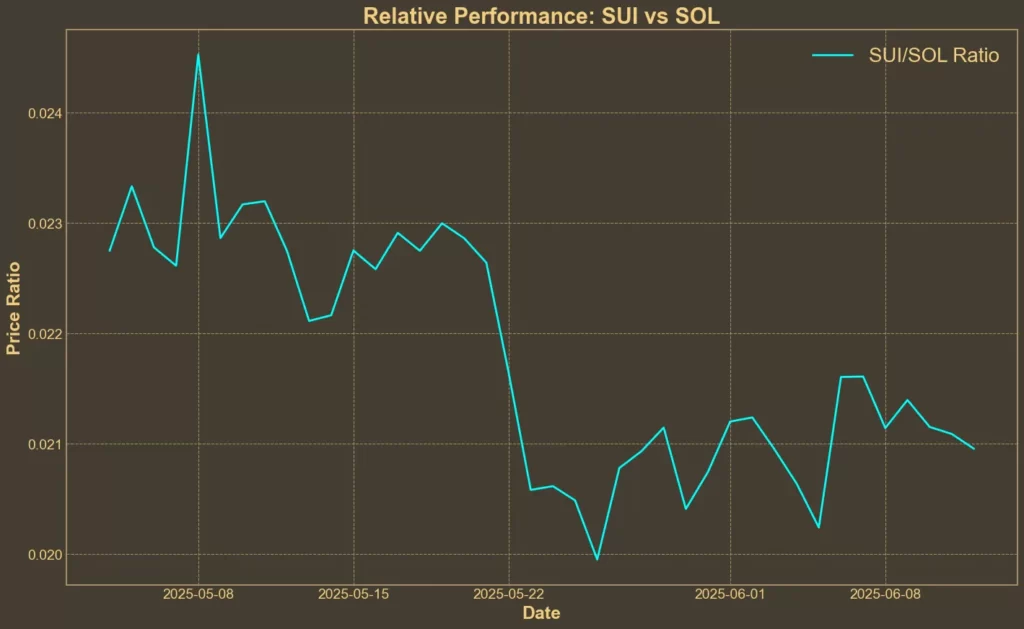
Comparison Against SOL: Long-Term Weakness
SUI has gained against SOL over the last 7 days, but remains down in the 30-day view. The SUI/SOL ratio has risen over 3.5% this week, even as it trails by over 5% on a monthly scale. That suggests a short-term rebound, but not enough to reverse the longer underperformance trend.
News & Sentiment
The recent announcement of the Nasdaq filing for a SUI ETF gave the token a much-needed boost. The price briefly surged past $3.49, fueled by ETF hype and heavy volume. That spike, however, proved unsustainable. Despite support forming near $3.45 and a brief attempt to reclaim momentum, the rally faded in afternoon U.S. trading.
Cetus Protocol, one of SUI’s key DeFi platforms, is now back online after a $223M exploit. The return of liquidity and community approval helped calm fears, but it hasn’t provided much price lift for SUI or CETUS. The damage was already done, and sentiment around the project is still healing.
At the same time, the fundamentals are shifting. Over $300 million is now allocated to SUI-based investment products, and if the ETF gets approved, that could significantly shift demand toward institutional inflows.
Final Thoughts
Most technical indicators show either neutrality or weak signals. Momentum is fading, the trend has stalled, and volume is down. Even with the ETF news and relaunch of Cetus, traders seem cautious. There’s no breakdown – but also no confirmation of a new breakout.
The overall picture is sideways. Support holds, but resistance hasn’t cracked. Technical analysis suggests this is a consolidation phase, and further direction will likely come from external triggers like ETF approval or macro shifts.


