In This Article:
- Sui reached an all-time high of $5.30 and a $15.4 billion market cap
- Technical analysis points to continued upward momentum for Sui, although potential short-term pullbacks may occur as it approaches overbought levels.
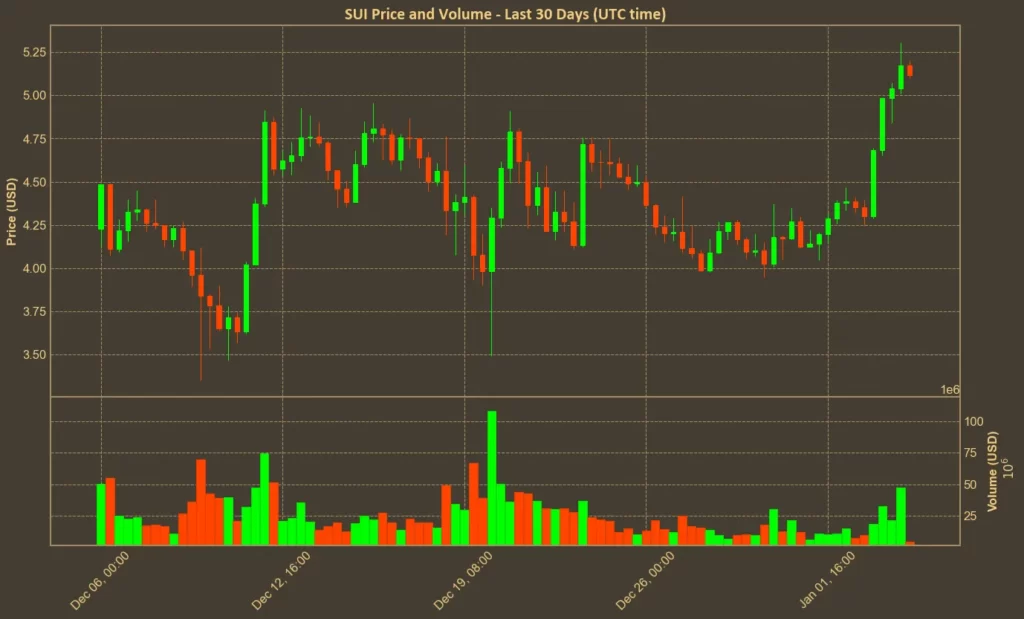
Sui, an advanced layer-1 blockchain platform that emphasizes security, scalability, and a seamless user experience, has been rapidly growing in the cryptocurrency market and today it set its new all-time high of $5.30.
Moreover, it is now holding the 12th spot with a market cap of $15.4 billion. At the moment of writing this article Sui’s price stands at $5.13, slightly below new record, yet still at levels never seen before in the coin’s history.

Table of Contents
Market Momentum
Over the past month, Sui has put on an impressive showing, with its price appreciating by 22% (though the majority of these gains occurred over the last few days) and an exceptional 185% surge over the previous quarter.
These gains are supported by a notable increase in trading volume, which has risen by 26% in the last day and an astonishing 208% over the past week. However, it’s worth noting a slight decrease in monthly volume by 18%.
Price momentum shows investors confidence, which is particularly significant when considering the November outage. During that event, block production was halted for two hours as SUI was strained by exceptionally high transaction volumes. The development team’s swift resolution and the prevention of similar issues since then have successfully maintained and reinforced investor trust.
Relative Strenght Index
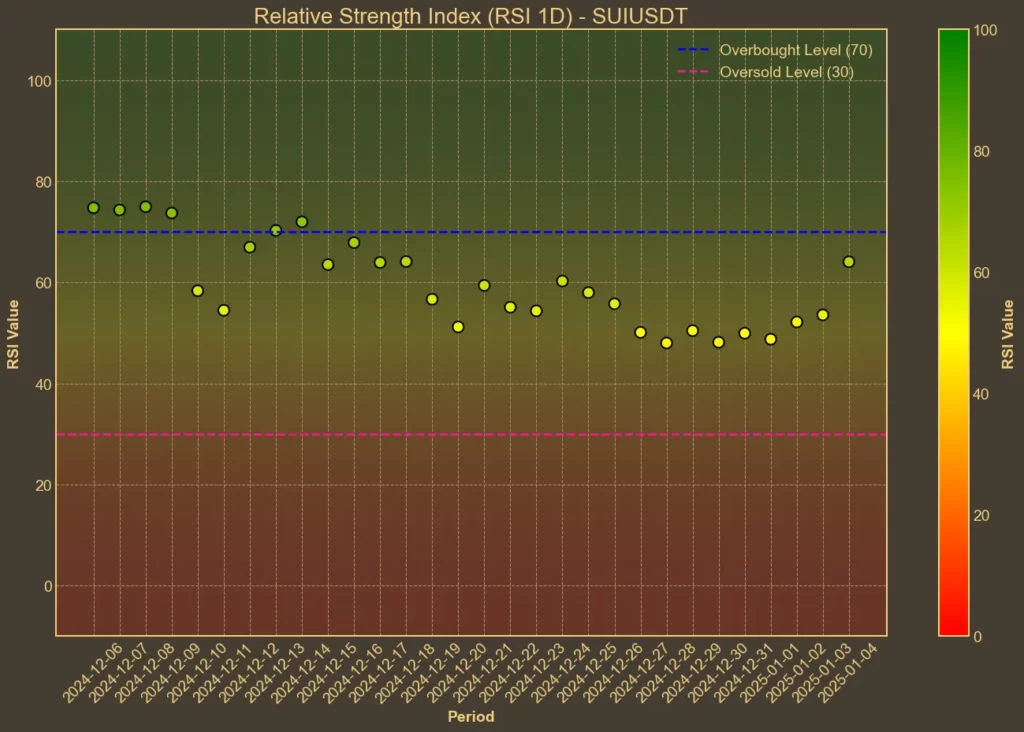
The Relative Strength Index (RSI) is currently at 66, up from 48 a week ago, indicating that Sui is approaching overbought territory. This suggests that the current bullish momentum might continue, but traders should remain cautious as the RSI nears levels that could signal a potential reversal.

Technical Indicators
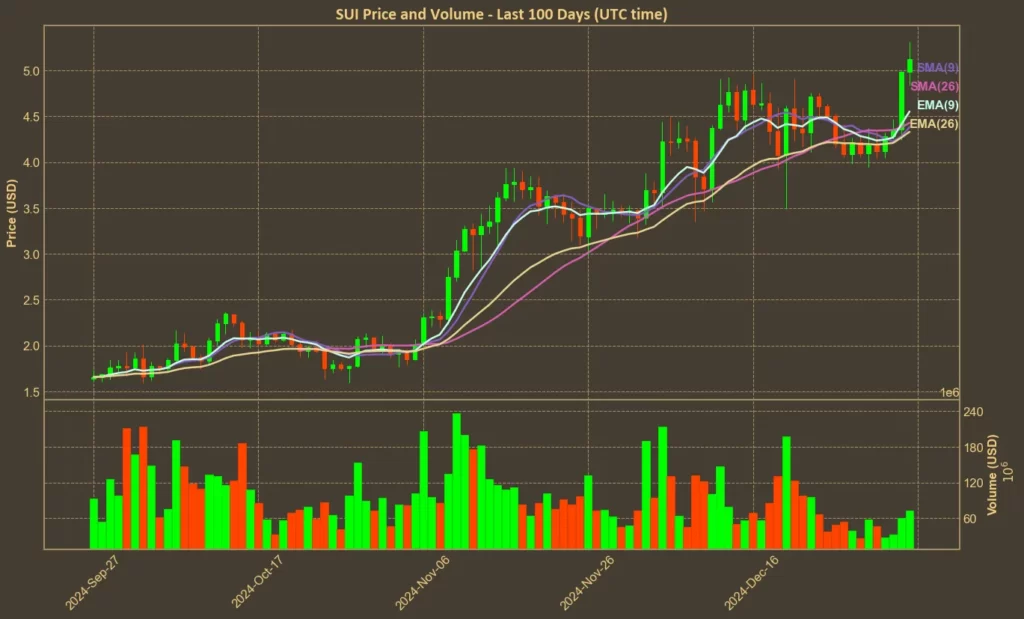
The Moving Averages (SMA and EMA) show a gradual upward trend despite recent slowdown, reinforcing the positive outlook for Sui. Moreover, the Moving Average Convergence Divergence (MACD) stands at 0.17, above its signal line of 0.13, further confirming bullish sentiment.

Bollinger Bands (BB) for Sui extend from $3.84 to $5.00, with the current price trading above the upper band. This positioning typically signifies robust buying pressure but also hints at possible resistance as the price continues to push upward.
The Average True Range (ATR) of 0.43 highlights the current volatility level, which, while present, remains manageable within the context of Sui’s recent price movements. The Awesome Oscillator (AO) has been trending up, currently at 0.2, suggesting that the momentum is in favor of upward price movement.
Moreover, the Directional Movement Index (DMI) shows a rising +DI at 21, while the Average Directional Index (ADX) is at 18. This combination indicates growing bullish strength without excessive volatility, supporting the case for continued upward movement.
What’s Next For SUI?
The technical indicators collectively paint a picture of a cryptocurrency on the rise. Sui’s sustained uptrend, supported by increasing market cap and trading volumes, points to a strong position within the market.
However, the rising RSI and the price near the upper Bollinger Band suggest that while the bullish momentum is likely to continue, investors should be prepared for potential pullbacks and profit-taking.
It’s important to recognize that while technical analysis offers valuable insights, it has its limitations. Market conditions can shift rapidly, and external factors such as regulatory changes or macroeconomic trends can unpredictably impact price movements. Therefore, even though Sui’s technical indicators are positive, they are based on historical data and do not guarantee future performance. Unexpected movements in Bitcoin or new developments related to institutional interest in Sui, such as the creation of new securities, could influence the price in ways that technical analysis does not account for.


