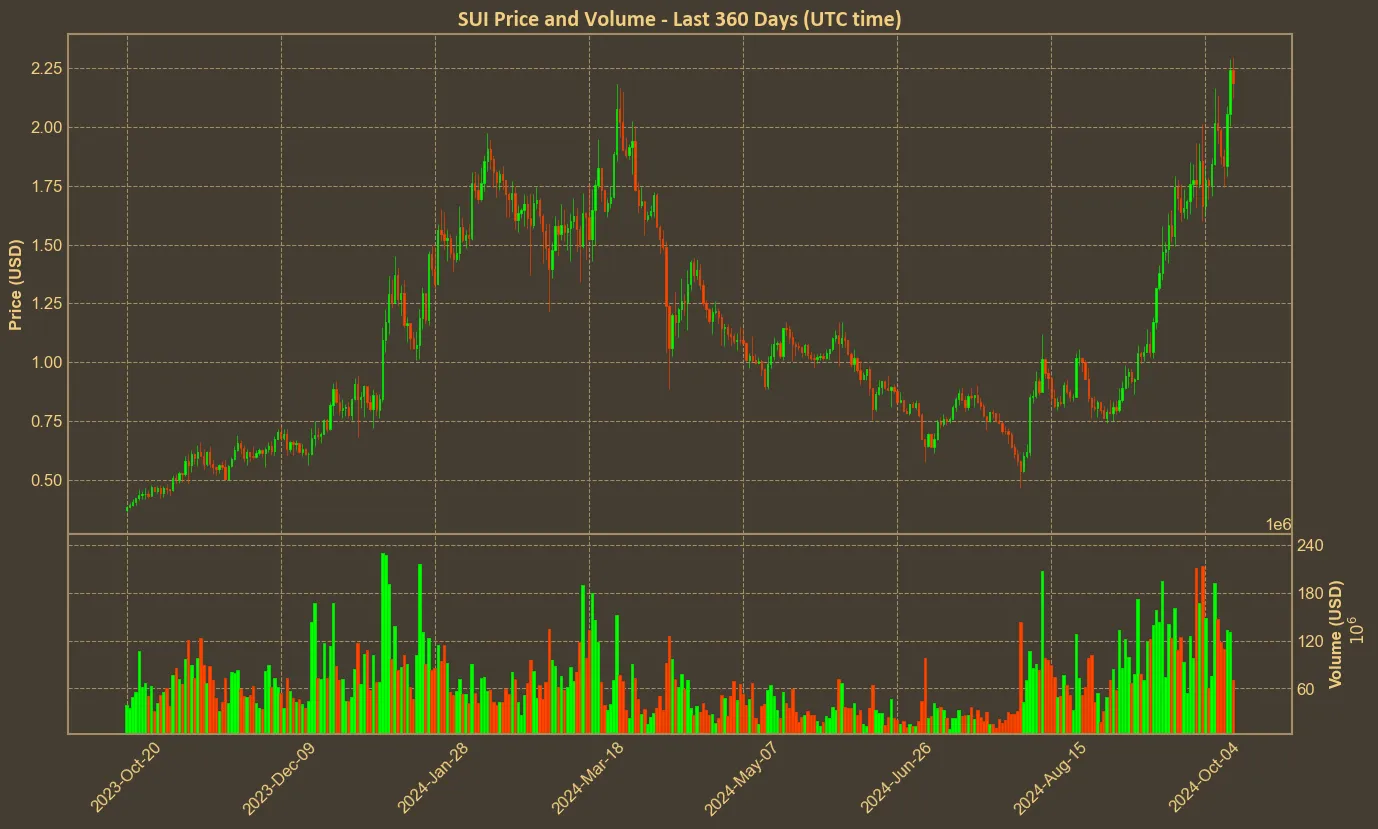
Sui has certainly caught the attention of investors in recent days. With a dramatic price increase (over 100% last month!), Sui has reached $2.28 yesterday – its all-time high! Today, priced at $2.21, Sui is walking the line between maintaining its momentum and succumbing to market exhaustion.

Assessing Momentum Through Indicators
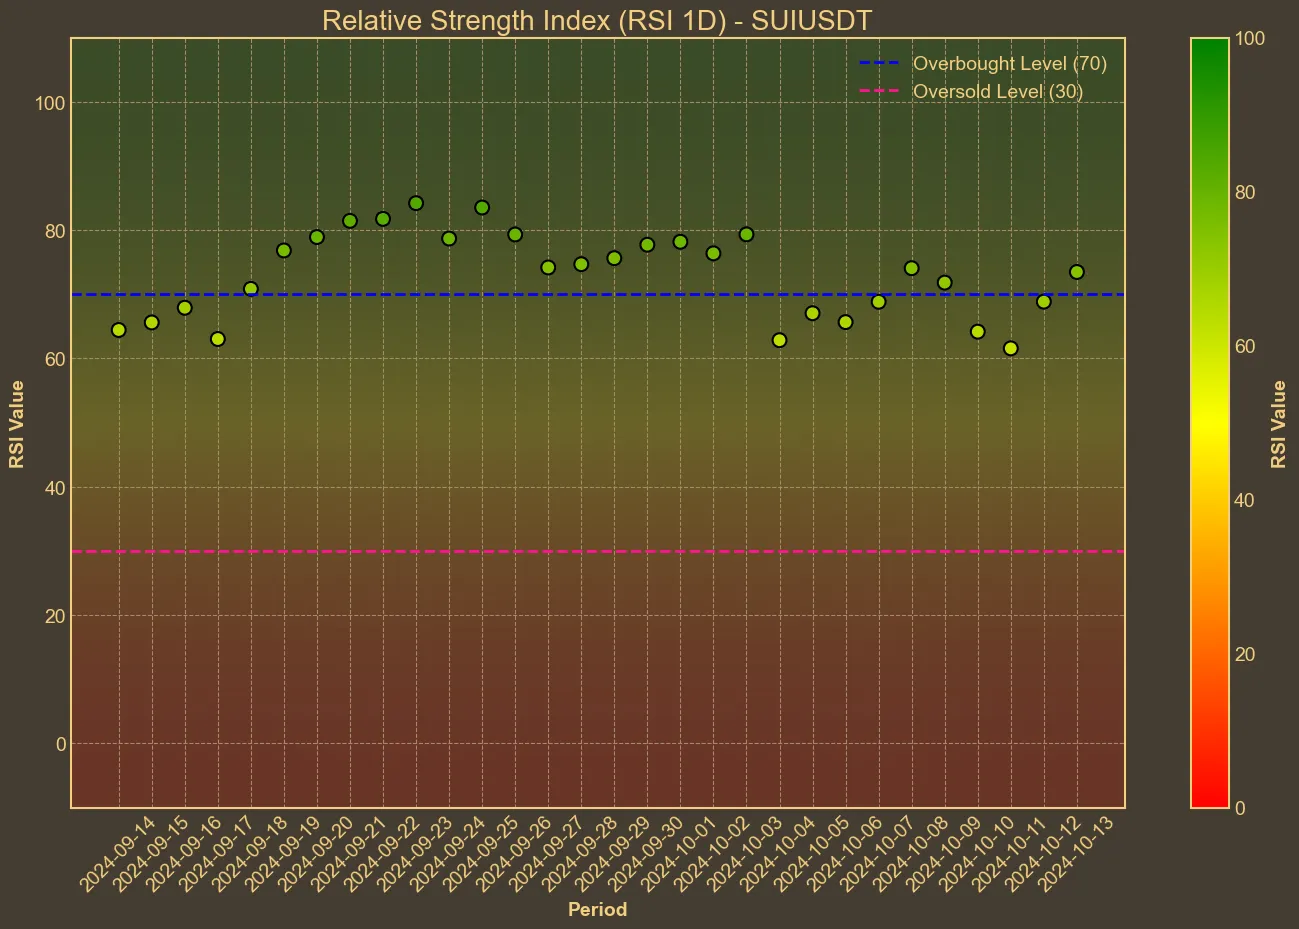
The technical indicators paint a picture of a coin with potential but also highlight signs of fatigue. The Relative Strength Index (RSI), a key momentum indicator, has hovered around the 70 mark for most of the past month. This level generally indicates that a market may soon reverse direction.

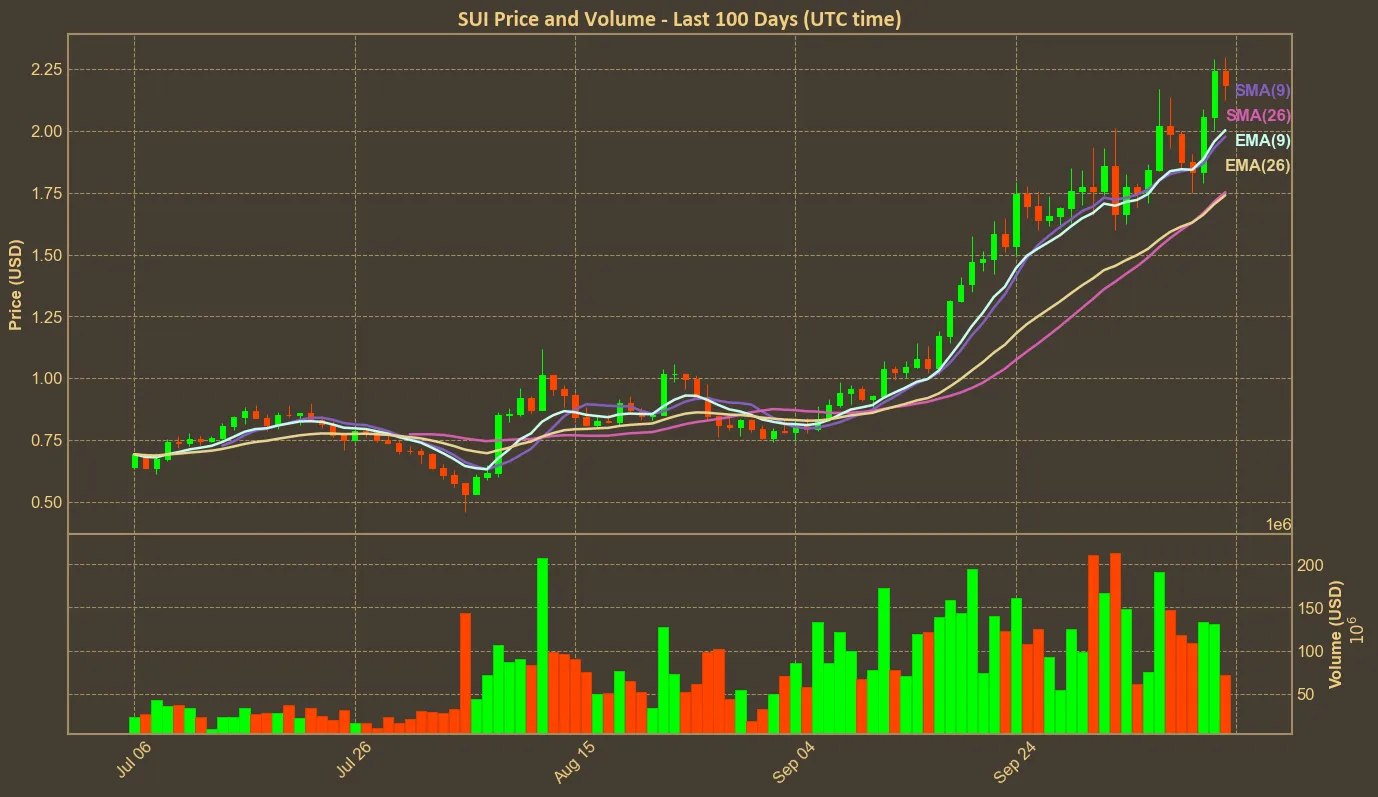
Meanwhile, both the Simple Moving Average (SMA) and the Exponential Moving Average (EMA) show a consistent upward trend, reinforcing the positive movement seen over the previous weeks.

The Bollinger Bands are suggesting an overbought market, as the price neared and surpassed the upper band threshold of $2.18. This may signal that a correction could be imminent, as well. The MACD remains positive, suggesting that, although the momentum is slowing, there is still room for growth before a possible reversal.
Market Cap and Volume Trends
Sui’s market capitalization has soared over the past month, marking a significant growth of 123%. However, a recent decline in trading volume, particularly over the last three days, raises questions about the sustainability of its price level. A 24% drop in daily trading volume is significant and often precedes a price correction in the absence of fresh bullish catalysts. This trend suggests that the initial hype might be cooling down.
While Sui has made impressive gains, one should approach its future with caution. The technical analysis points to a potential pullback, and it is critical to keep an eye on key support levels that could influence further movements. However, while technical analysis provides valuable insights, it is only one piece of the puzzle. It may not fully account for market anomalies or unforeseen news that can heavily impact prices.


