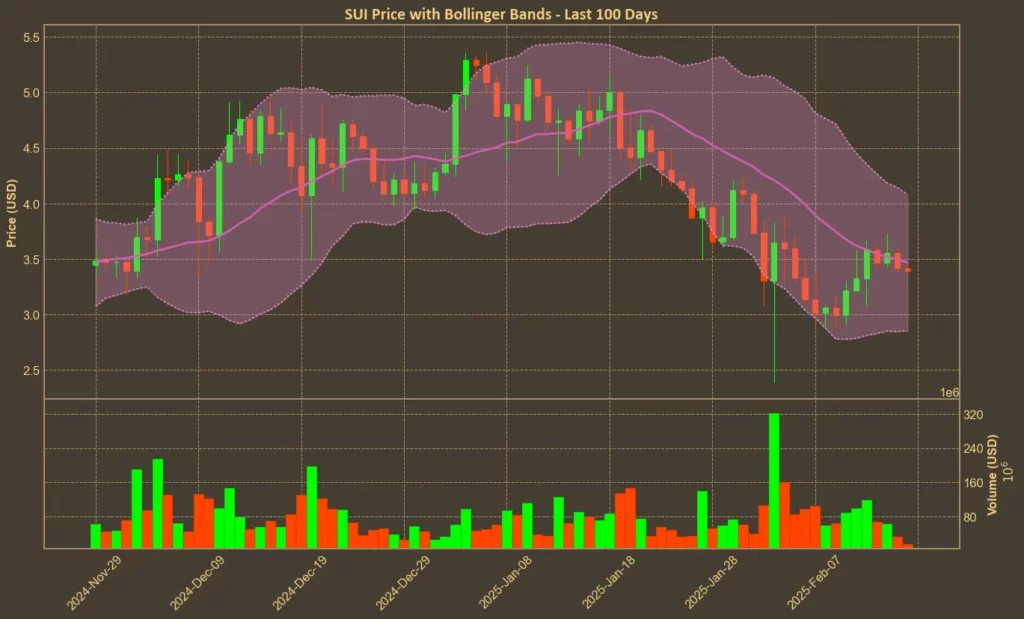
Sui’s price action has been turbulent in recent weeks. While the coin saw a steep decline over the past month, it has since regained some ground. However, with trading volume continuing to drop, market sentiment remains uncertain.
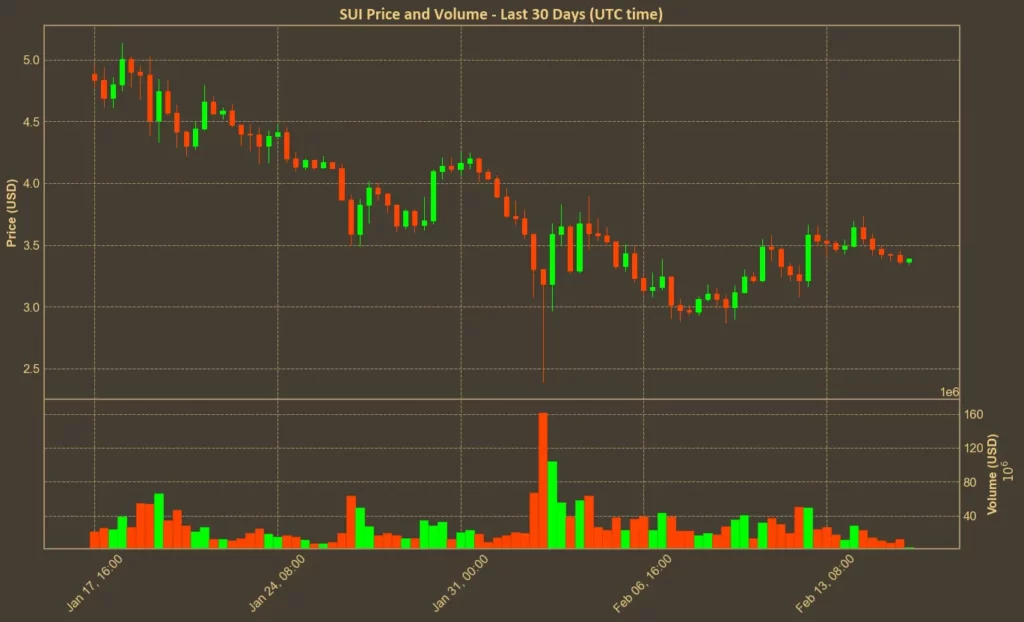
Currently trading at $3.39, Sui has lost 31% of its value over the past month. However, a 9% gain in the last week suggests that the downtrend may be easing and a recovery could be underway. But do technical indicators confirm this shift? Let’s take a closer look.
Table of Contents
Momentum Indicators
RSI: Neutral
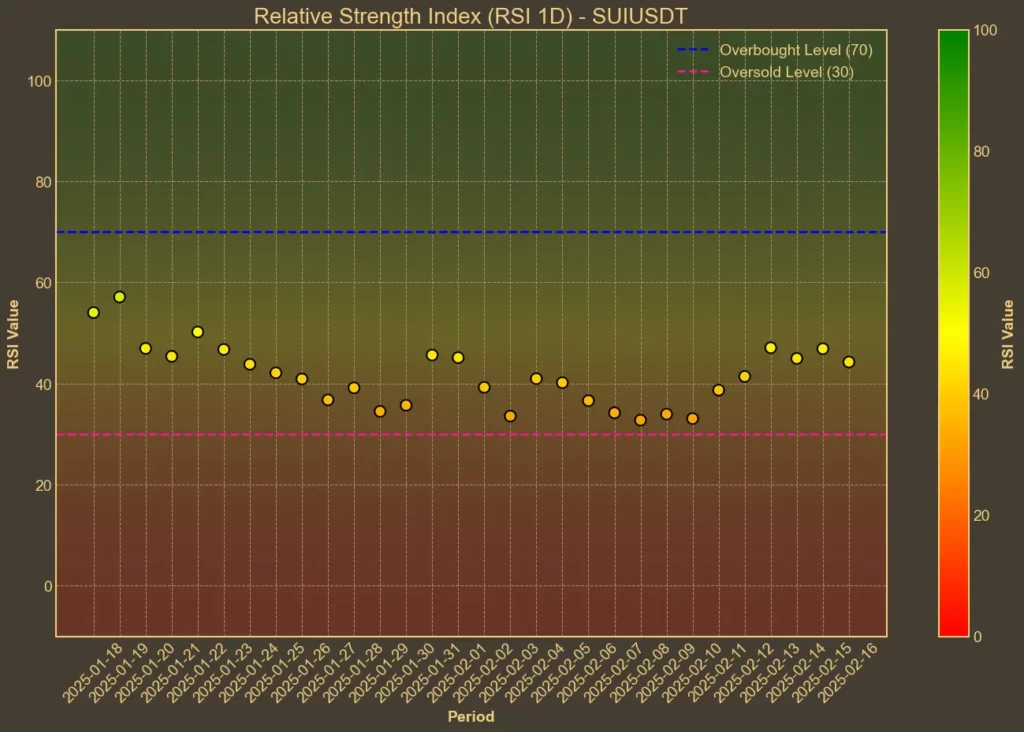
The Relative Strength Index (RSI) measures whether an asset is overbought or oversold. Currently, Sui’s RSI(14) stands at 44, unchanged from yesterday, but up from 33 a week ago. The short-term RSI(7) is 47, slightly lower than yesterday’s 48. These values suggest that selling pressure has eased, but the market lacks strong momentum in either direction.
MFI: Neutral
The Money Flow Index (MFI) incorporates both price and volume to assess buying and selling pressure. Sui’s MFI(14) has risen to 49, up from 46 yesterday and 27 last week. The increase in MFI suggests that capital inflows have strengthened recently, reducing selling pressure.
Fear & Greed Index: Neutral
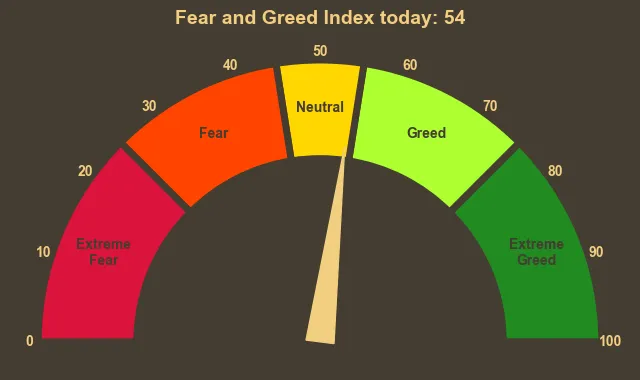
The broader crypto market’s sentiment is measured by the Fear & Greed Index. Today’s reading is 54, compared to 50 yesterday and 46 a week ago. This indicates a shift toward a more neutral stance after recent uncertainty, suggesting that investors are regaining confidence.
Moving Averages
SMA & EMA: Bearish
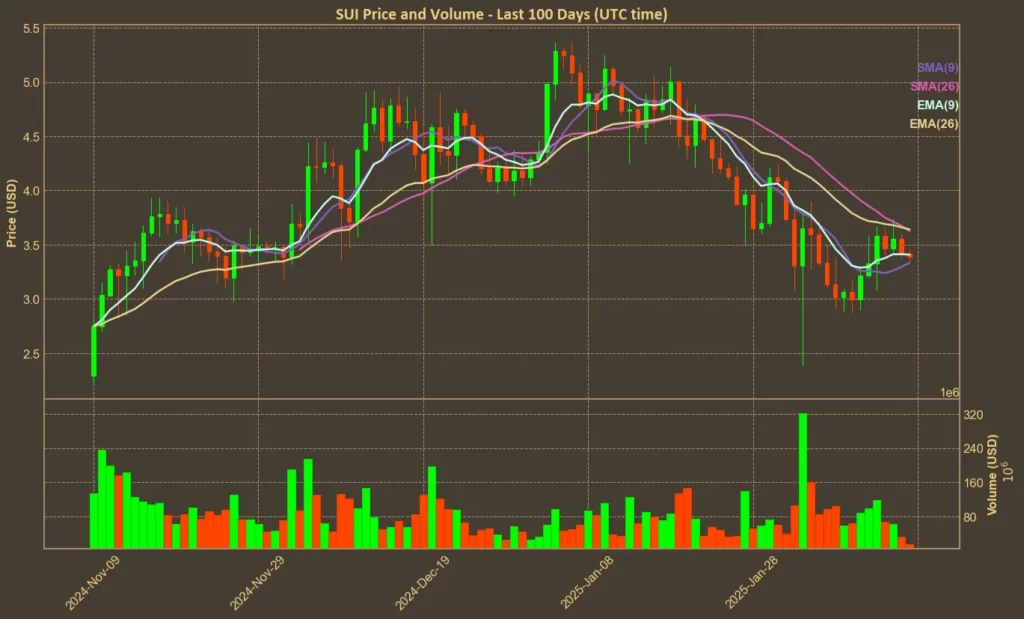
Simple and exponential moving averages provide insights into long-term trends.
- Current SUI price: 3.39
- SMA(9) today: 3.33
- EMA(9) today: 3.41
- SMA(26) today: 3.63
- EMA(26) today: 3.64
Sui’s price remains below the 26-day EMA and SMA, which typically signals a bearish outlook. However, the 9-day EMA is slightly above the current price, suggesting that short-term momentum may be improving.
Bollinger Bands: Neutral
Bollinger Bands measure volatility and indicate potential breakout points. The upper band is 4.08, while the lower band is 2.85. Sui’s price is currently trading near the middle of the range, which suggests a balanced market with no clear breakout direction at the moment.
Trend & Volatility Indicators
ADX: Moderate Trend
The ADX(14) is 38, unchanged from yesterday and slightly lower than 39 a week ago. This suggests that while a trend exists, it is not particularly strong.
ATR: Decreasing Volatility
The ATR(14) is 0.4, down from 0.42 yesterday and 0.46 a week ago. This decline in ATR suggests that price swings are becoming smaller, indicating lower volatility.
AO: Bearish
The Awesome Oscillator (AO) helps confirm trend momentum. Currently, AO is at -0.42, slightly up from -0.45 yesterday but significantly higher than -0.99 a week ago. The negative value suggests bearish momentum, though it has been weakening.
VWAP: Bullish
The VWAP today is 3.95, which is above the current price. This indicates that Sui is undervalued relative to recent trading volume and could see a short-term uptick if volume returns.
Relative Performance
Comparison Against SOL: Recovering
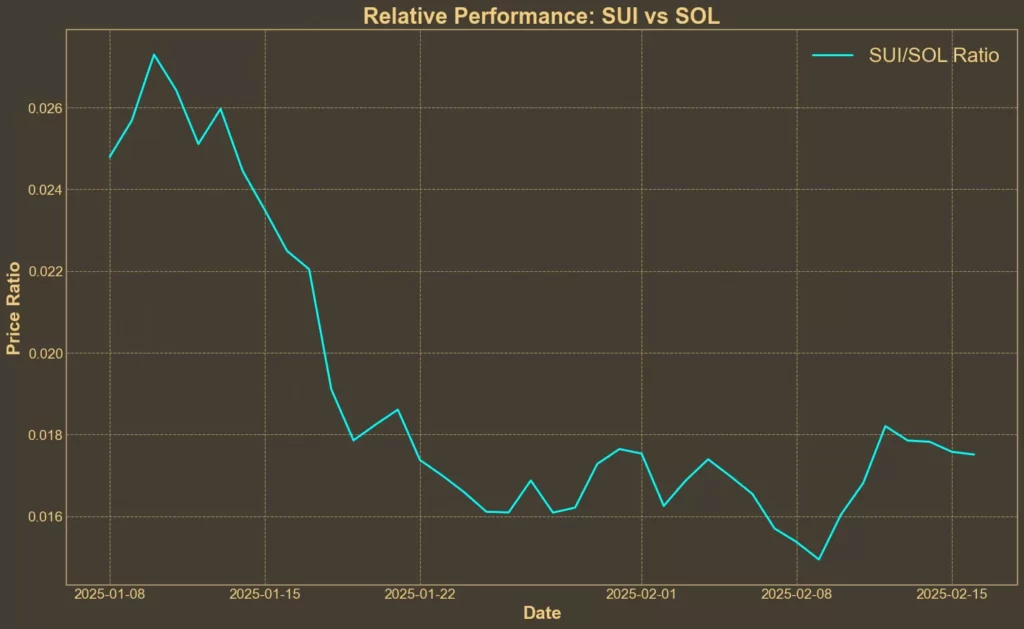
Sui is often compared to Solana, making it natural to measure its performance against it. The SUI/SOL ratio is 0.0175, reflecting a 17.1% increase over the past week but an 8.39% drop in the last month. This suggests that Sui has been gaining strength against Solana recently, but it still has ground to recover over the longer term.
Conclusion
Technical indicators present a mixed picture for Sui. While momentum indicators suggest stabilization, the overall trend remains weak. Moving averages indicate a bearish outlook, but decreasing volatility and improving relative strength against Solana hint at potential recovery.
However, it’s crucial to remember that technical analysis alone cannot predict fundamental shifts in the market. With trading volume still declining and overall market conditions uncertain, Sui’s future trajectory remains unpredictable. Any major developments – whether specific to Sui or the broader crypto market – could trigger sudden price movements in either direction.
Need a quick and easy way to see what’s happening in crypto over the next few days? Check out our Crypto Events Calendar!


