Pepe (PEPE), currently the third-largest memecoin by market cap, has recently stabilized near the $0.000007 mark following a series of declines. The token is down 23% this month and nearly 75% from its all-time high in December. Even so, it maintains a $3 billion market cap – and there are early signs that the downtrend could be losing steam. Here’s what the data shows.
Table of Contents
Why Did Pepe Fall So Much?
PEPE’s recent decline wasn’t driven by the token itself, but by sentiment shifts in the memecoin sector. One of the main catalysts was the launch of the TRUMP meme token, which quickly reached a multi-billion-dollar valuation. This drew liquidity and market cap away from other memecoins. Even after dropping to just $11, TRUMP still holds over $2 billion in market cap – capital that might otherwise be spread across other memecoins like PEPE.

Scandals surrounding other meme projects may have also weakened investor confidence. Tokens like TRUMP and MELANIA left many holders with significant losses, while the LIBRA disaster further damaged sentiment. These events highlighted how easily memecoins can be influenced – or manipulated – by high-profile figures. The weak sentiment is also reflected in declining activity on launchpads such as Pump.fun.
Finally, the overall crypto market has struggled under the weight of escalating trade tensions and geopolitical uncertainty. With major tokens and traditional markets falling, some investors appear to be cutting exposure to high-risk assets like memecoins.
Momentum Indicators
RSI: Neutral
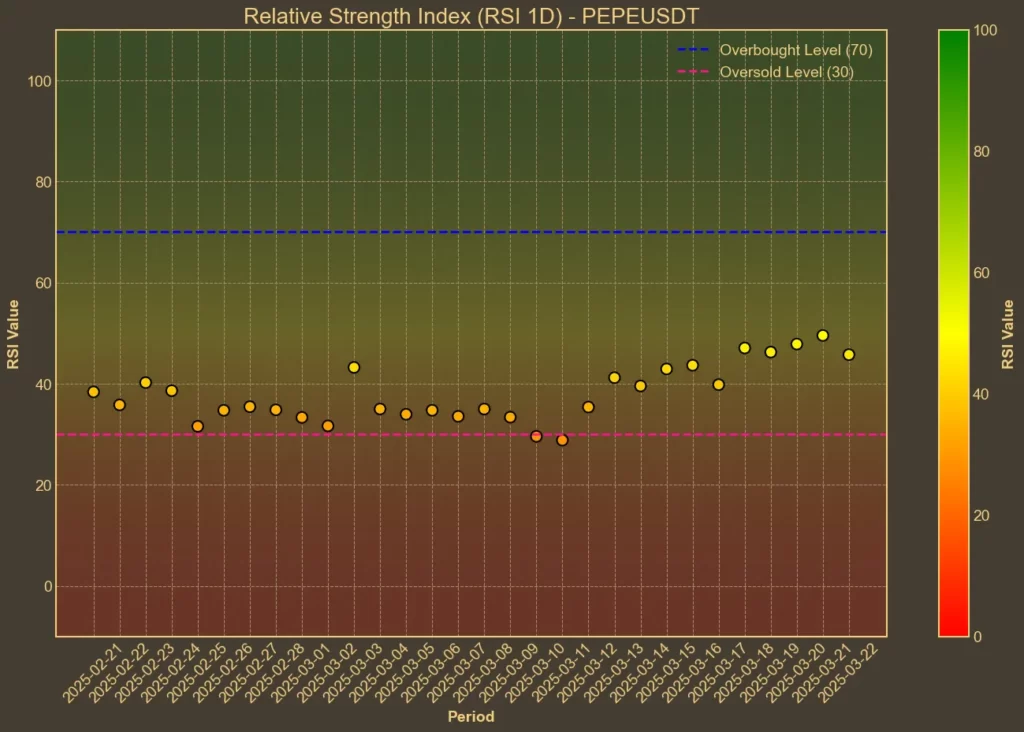
The Relative Strength Index (RSI) is hovering just under the midpoint. With a 14-day RSI of 46 and a 7-day RSI of 52, the market appears neither overbought nor oversold. Momentum is present, but limited. It’s a wait-and-see setup – typical in periods just before trend reversals.
MFI: Bullish
The Money Flow Index, which includes volume data, is showing an increase in buying strength. A current reading of 65 suggests more capital is flowing into PEPE, even as price remains flat. That can be a bullish divergence if sustained.
Fear & Greed Index: Fear
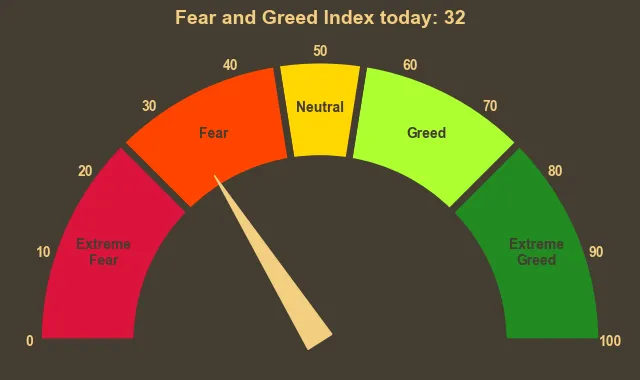
The broader crypto market sentiment has taken a step back into fear territory. A value of 32 reflects general investor unease. While this doesn’t reflect PEPE alone, sentiment across the board tends to impact memecoins heavily, especially when retail interest is involved.
Moving Averages
SMA & EMA: Mixed
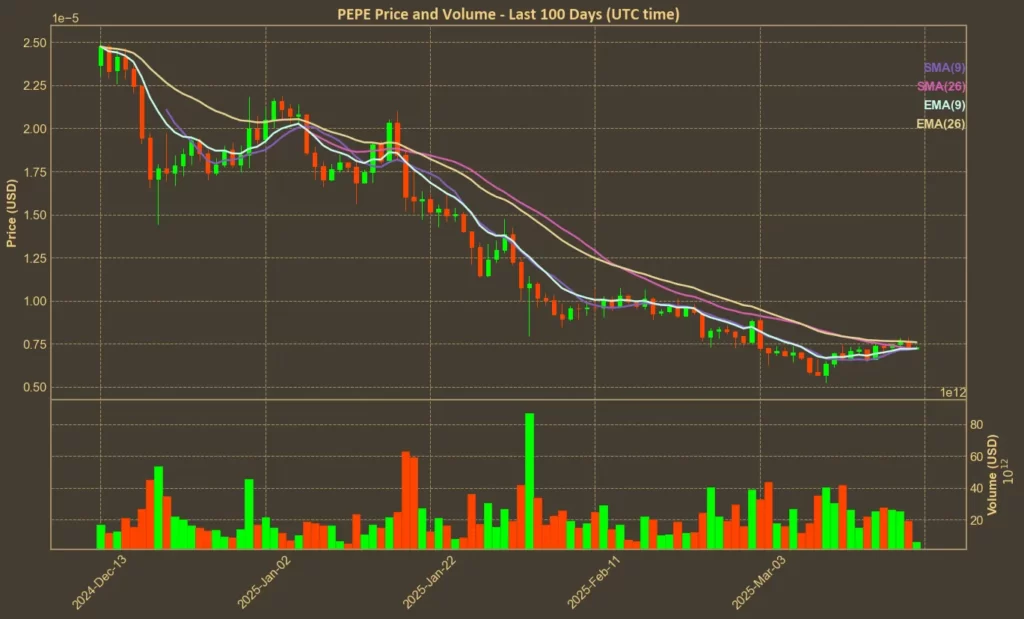
Short-term averages are almost identical to the current price, which confirms that PEPE is consolidating. The 9-day SMA and EMA show minor alignment with the 26-day averages, but EMA(26) remains slightly higher. This doesn’t yet confirm a trend reversal, but it shows that the price is holding ground rather than slipping further.
Bollinger Bands: Low Volatility
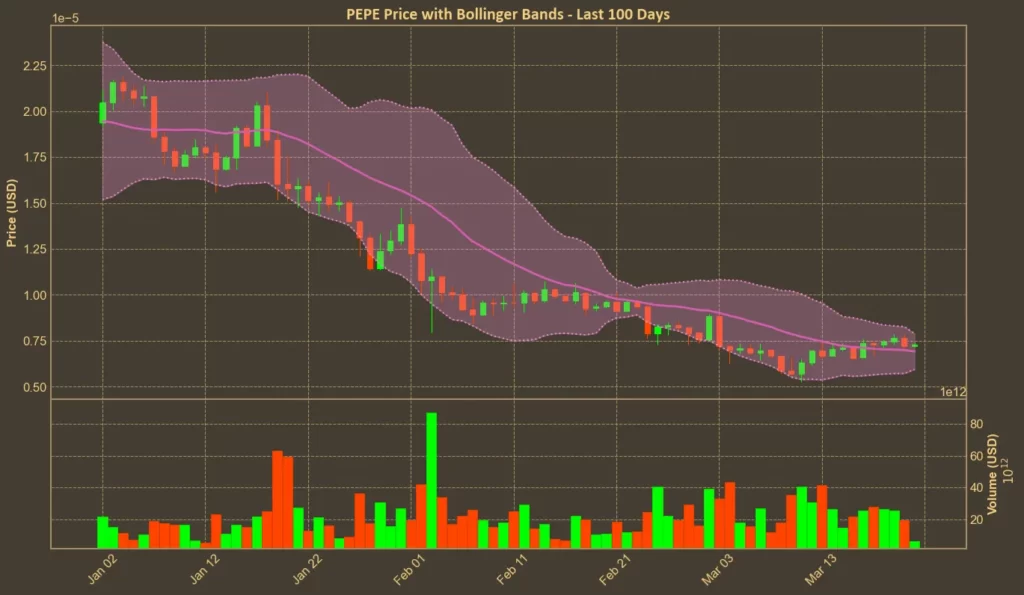
The current price is sitting in the lower half of the Bollinger Bands, indicating reduced volatility. PEPE is not showing a breakout attempt yet, but narrowing bands often precede sharper price movements. If volume returns, a breakout – up or down – becomes more likely.
Trend & Volatility Indicators
ADX: Weakening Trend
ADX has dropped from 36 to 29 in the past week, confirming that the recent strong downtrend is losing momentum. This isn’t necessarily bullish, but it does mean that bears are no longer in full control.
ATR: Decreased Volatility
The Average True Range is declining, indicating that recent price swings are getting smaller. While it may signal reduced trader interest, it can also mean a larger move is brewing.
AO: Weak Bullish Momentum
The Awesome Oscillator is still below zero but improving. From a deeply negative value a week ago, it is climbing toward neutrality. This could support the view that sellers are stepping back, though buyers haven’t fully stepped in yet.
VWAP: Bearish
VWAP sits noticeably above the current price. PEPE is trading below its average price weighted by volume, which confirms that buyers are not yet dominant.
Relative Performance
Comparison Against DOGE: Outperforming
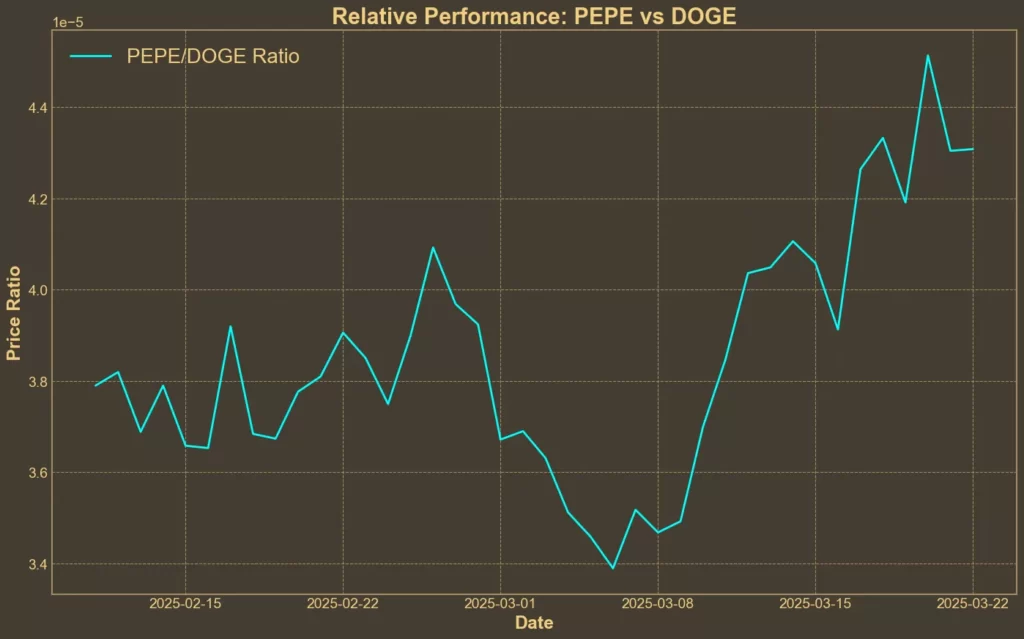
PEPE has gained more than 6% against DOGE over the past week, and nearly 13% over the past month. While this doesn’t tell us about PEPE in isolation, outperforming the leader of memecoins suggests that relative strength is returning.
Read also: Dogecoin Approaches Critical $0.19 Level: Is a Reversal in Sight?
What Might Be Next?
While technicals don’t guarantee future moves, they do show PEPE is currently stabilizing after weeks of high volatility. Bybit’s quiet accumulation of PEPE tokens through hidden wallets adds weight to this moment. Large buyers don’t enter randomly – they tend to position at or near expected bottoms.
If PEPE can hold above the $0.000007 level, it could attract new buyers. Short-term targets of $0.0000085 and $0.0000100 are on the table if the market continues to recover. However, losing that support might lead to a retest of $0.00000670 or even $0.00000589, which was recently swept for liquidity.
Read Also: 6 Reasons Why Crypto Is More Volatile Than Other Assets


