Avalanche (AVAX) stands as the 12th largest cryptocurrency in the market, with a current price of $27.3. Recent trends reveal significant price fluctuations, indicating unique movement patterns not commonly seen among its peers. While the overall yearly gain stands at 206%, the last quarters have shown more mixed results, reflecting the coin’s complex market behavior.
Table of Contents
Short-Term vs Long-Term Trends
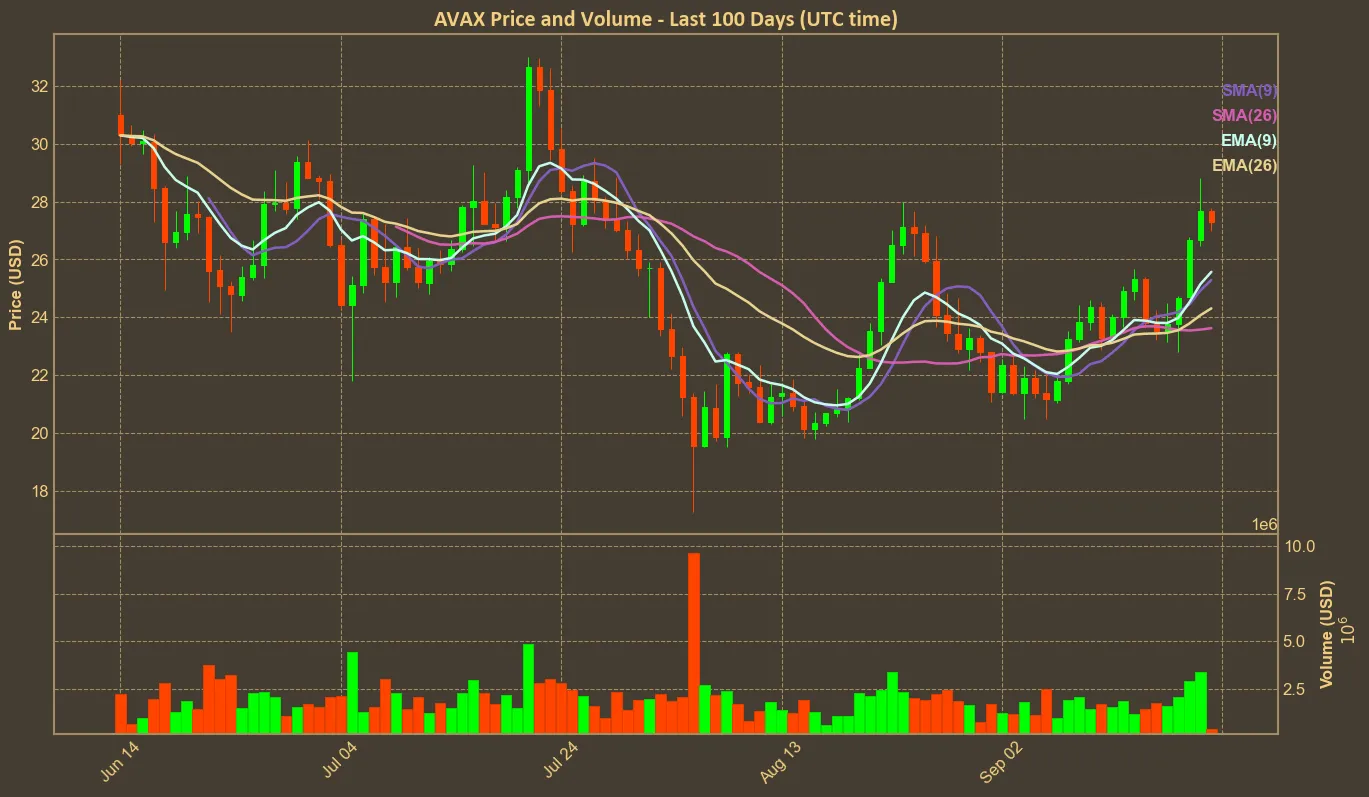
In the short term, the last hour saw a slight uptick, with a 0.25% increase. However, a wider lens reveals a drop of 3% in the past 24 hours. This apparent slide contrasts sharply with the weekly gain of 9.5%, fueled mostly by the FED interest rate decision. Moving further back, the monthly increase of 17.2% demonstrates a potentially bullish pattern, particularly after a subdued quarter with a 5.7% rise. Thus, while day-to-day observations might seem discouraging, the overall picture presents a more balanced perspective. It is important to remember though that in March AVAX was above $60, and then lost over half of its value in the next months.
Reading the Indicators
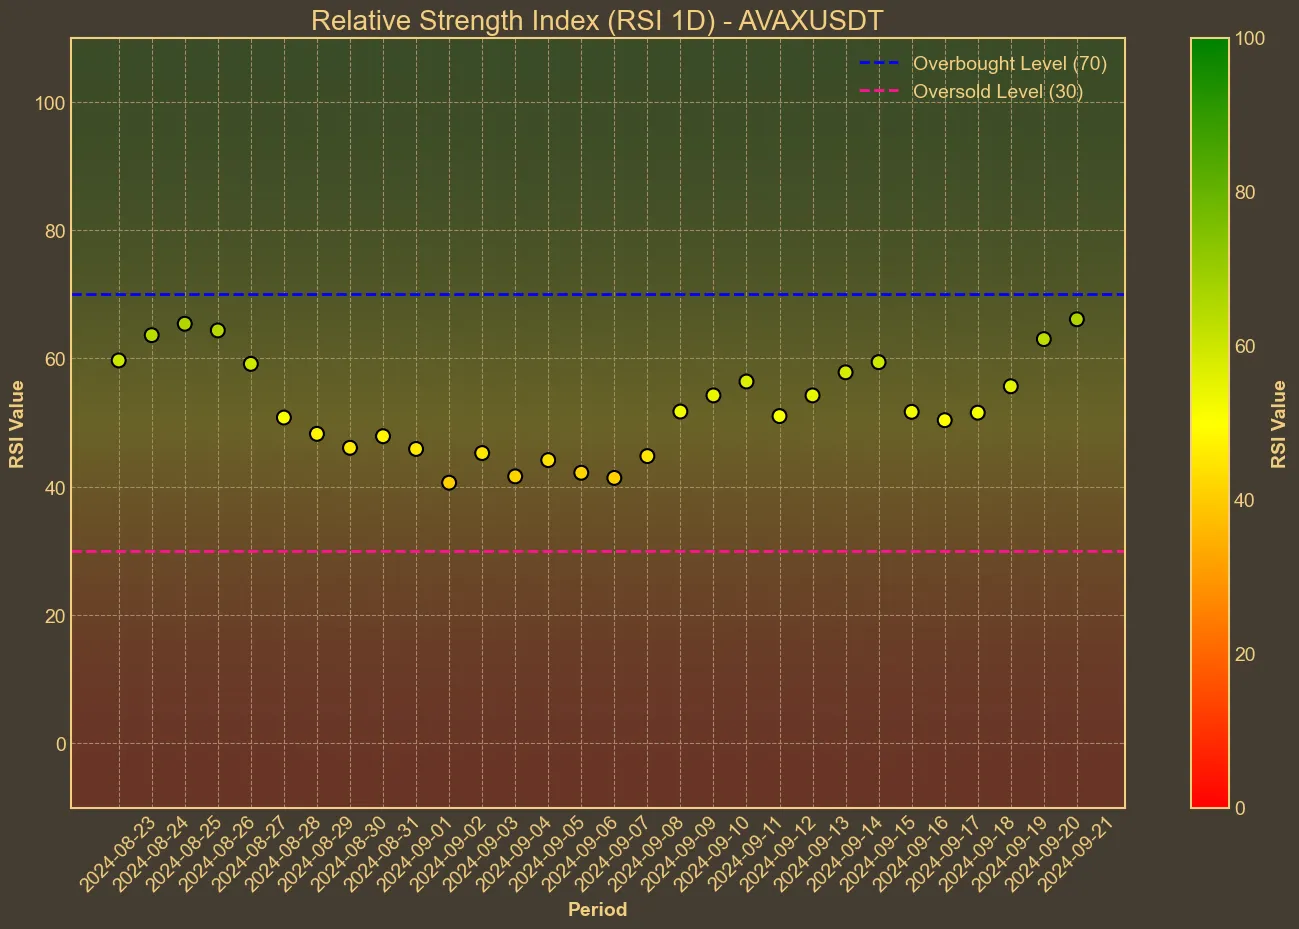
Several technical indicators offer deeper insights into Avalanche’s near-term movements. The Relative Strength Index (RSI) remains in a moderately strong position at 64, though it has dipped slightly from 66 just a day before. This suggests the coin is neither overbought nor oversold, resonating with the mixed short-term price data.
 The Simple Moving Average (SMA) and Exponential Moving Average (EMA) indicators remain relatively stable, hovering around 23.63 and 24.31 respectively. Bolinger Bands (BB_H and BB_L) display a price range between $20.11 and $27.52, suggesting room for continued volatility.

Additionally, the Moving Average Convergence Divergence (MACD) of 0.87 and its signal at 0.42 support a cautiously optimistic outlook, given their positions above the neutral line. The Average True Range (ATR) indicator at 1.51 indicates a moderate level of volatility, which aligns with what we observe in the price changes. Furthermore, the Awesome Oscillator (AO) trend has increased to 1.8, reinforcing the positive short-term momentum despite recent pullbacks.
Implications for Investors
Considering these trends and indicators, it’s imperative to exercise caution in predictions. The volume data, noting a significant drop by 26.3% in the last day, could signal diminishing interest or a temporary pause by traders. The RSI and other momentum indicators suggest that while there is bullish sentiment, it’s not overwhelmingly strong. Investors should recognize the limitations inherent in technical analysis. Market conditions, regulatory changes, and other unforeseen factors can swiftly alter the landscape.
In conclusion, Avalanche demonstrates a unique blend of volatility and potential, underpinned by positive technical signals. However, caution and a diversified approach will be your best allies in navigating this complex market.


