Cardano has had a rough stretch lately. After showing strength earlier in the year, the current price of $0.62 shows a steady downward trend. It’s not a dramatic collapse – but it’s not looking healthy either.
In the past three months, the token has shed more than 40% of its value. Weekly, daily, and even hourly charts are painted red. Momentum is weak, and volume is drying up. Yet despite the slide, technical signals suggest the market hasn’t made up its mind.
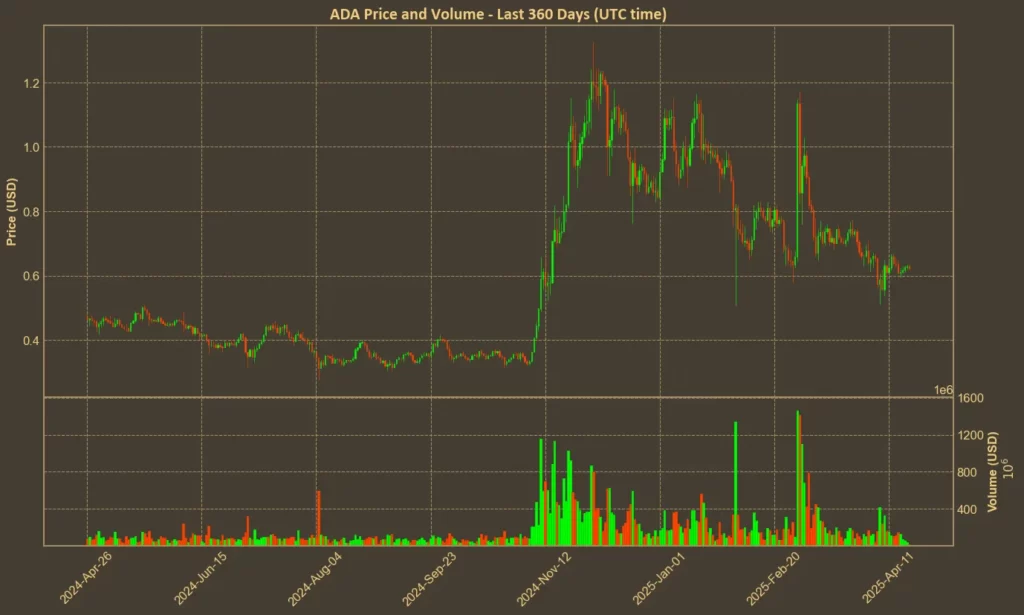
Table of Contents
Momentum Indicators
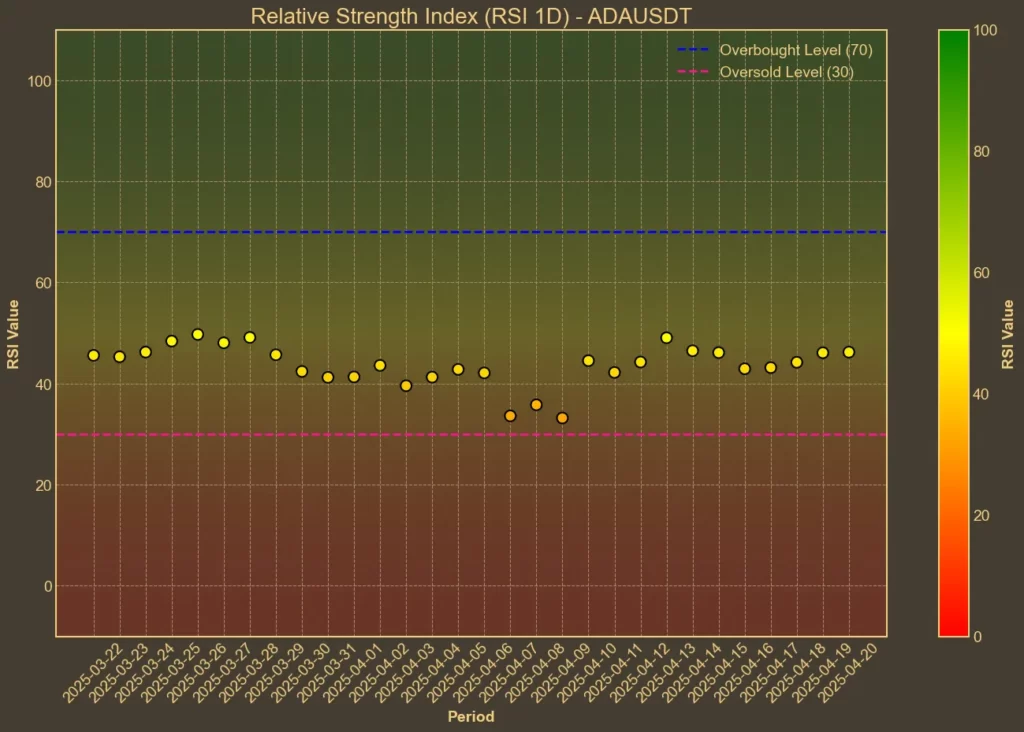
RSI: Neutral
The Relative Strength Index is currently hovering in the mid-40s. RSI(14) is at 45 – just under the neutral 50 line – while the short-term RSI(7) has dropped to 47. These values don’t show any panic selling, but they also don’t show much strength.
If buyers were stepping in, we’d see higher RSI across the board. Right now, there’s no clear momentum.
MFI: Neutral
The Money Flow Index is a bit more optimistic. At 56, it’s holding above the midpoint and has improved over the past week. Volume is playing a bigger role here, which may suggest that some traders are quietly accumulating, even as the price falls. That said, the recent volume trend is still down. MFI could be picking up temporary activity rather than any long-term shift.
Fear & Greed Index: Fear
The broader market is still leaning toward fear. Today’s reading is 37, slightly above the lows from earlier in the week but well below neutral. Last week the index was at 45 – meaning sentiment has clearly worsened. This doesn’t directly reflect Cardano’s internal health, but it shows how cautious traders are, even when looking at top-10 assets.

Moving Averages
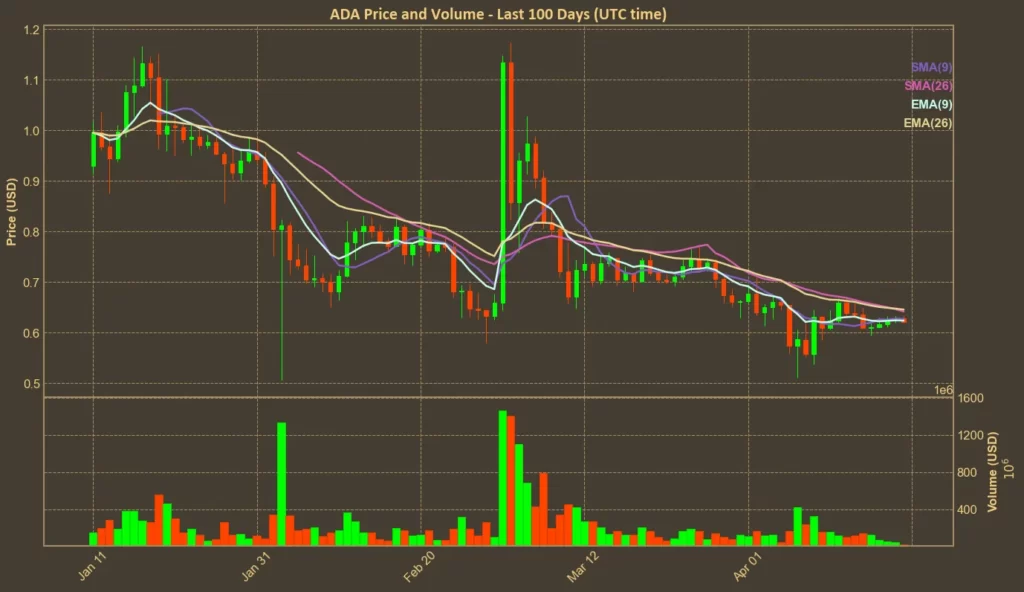
SMA & EMA: Bearish
Short-term and medium-term moving averages are all pointing down. The 9-day SMA sits at 0.6273, slightly above the current price. But both the 26-day SMA and EMA – at 0.6416 and 0.6455 respectively – remain well above the current levels. That’s a bearish sign. The trend is still down, and price would need a move upward just to retest the averages.
Bollinger Bands: Increased Volatility
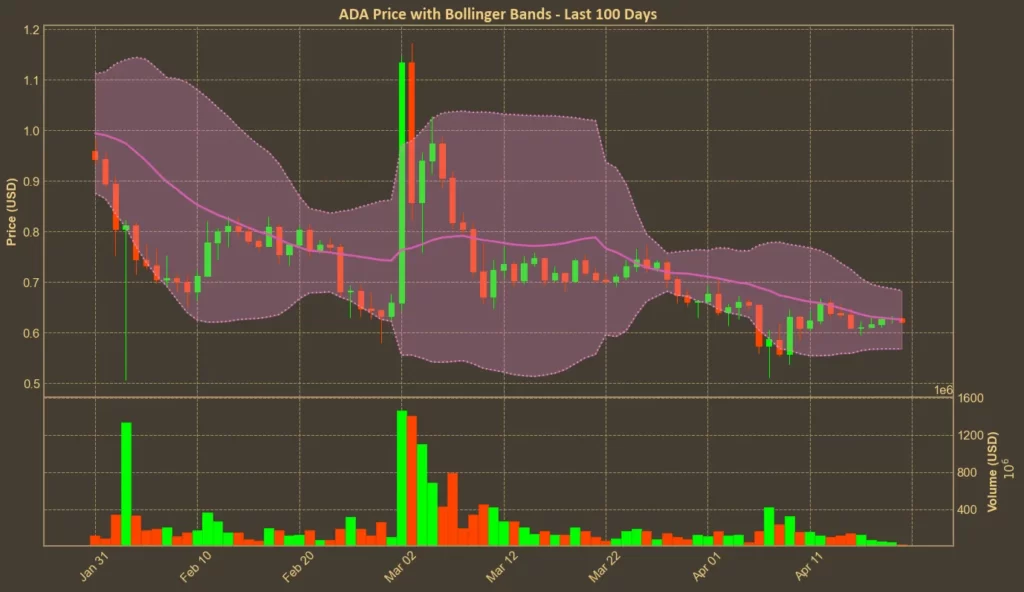
Bollinger Bands are wide, with the upper band at 0.6832 and the lower band at 0.5679. The price is closer to the bottom than the top, signaling some oversold pressure. But there’s still room for more downside before the bands signal a technical bounce. It’s a sign of high volatility – but not necessarily direction.
Trend & Volatility Indicators
ADX: Weak Trend
The Average Directional Index is sitting at 19, which confirms the trend is weak. Despite the downward movement in price, this isn’t a strong, trending selloff – it’s more like a quiet drift. That’s both good and bad. It means there’s still room for recovery, but also shows that bulls aren’t pushing back yet.
ATR: Decreasing Volatility
The Average True Range has fallen from 0.058 to 0.0442 over the past week. Lower ATR means less daily price movement. For now, Cardano is drifting rather than swinging – suggesting that traders are staying on the sidelines.
AO: Bearish
The Awesome Oscillator is still negative at -0.0405, slightly better than a week ago but not enough to change direction. It confirms what other indicators show: momentum is negative, but not accelerating.
VWAP: Overvalued
With the VWAP at 0.8314, there’s a big gap between the current price and the volume-weighted average. That implies Cardano is trading well below where traders have historically been buying. It also suggests that short-term holders are sitting on losses – and may be waiting for a bounce to sell.
Relative Performance
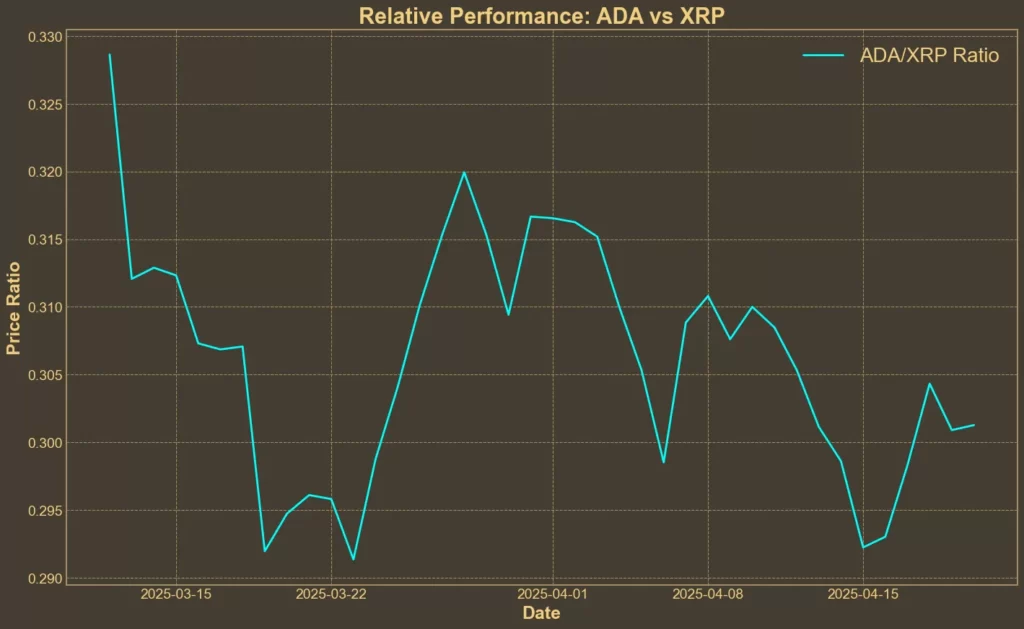
Comparison Against XRP: Stable
The ADA/XRP ratio has risen very slightly over both the weekly and monthly view. The movement isn’t large enough to signal a real advantage, but it does suggest that ADA isn’t underperforming as much relative to other top coins. This fits with the broader picture – weak momentum, but no sudden collapse.
Final Thoughts
Across the board, indicators are mixed but tilting bearish. Momentum is low, volatility is shrinking and trends are weak. And while there’s no sign of panic, there’s also little reason to expect a sudden recovery. The recent downtrend hasn’t broken – but it’s also not accelerating. This could mean consolidation, or a setup for another leg down.
Read also: Spot Crypto ETFs: Who’s Next in Line for Approval?


