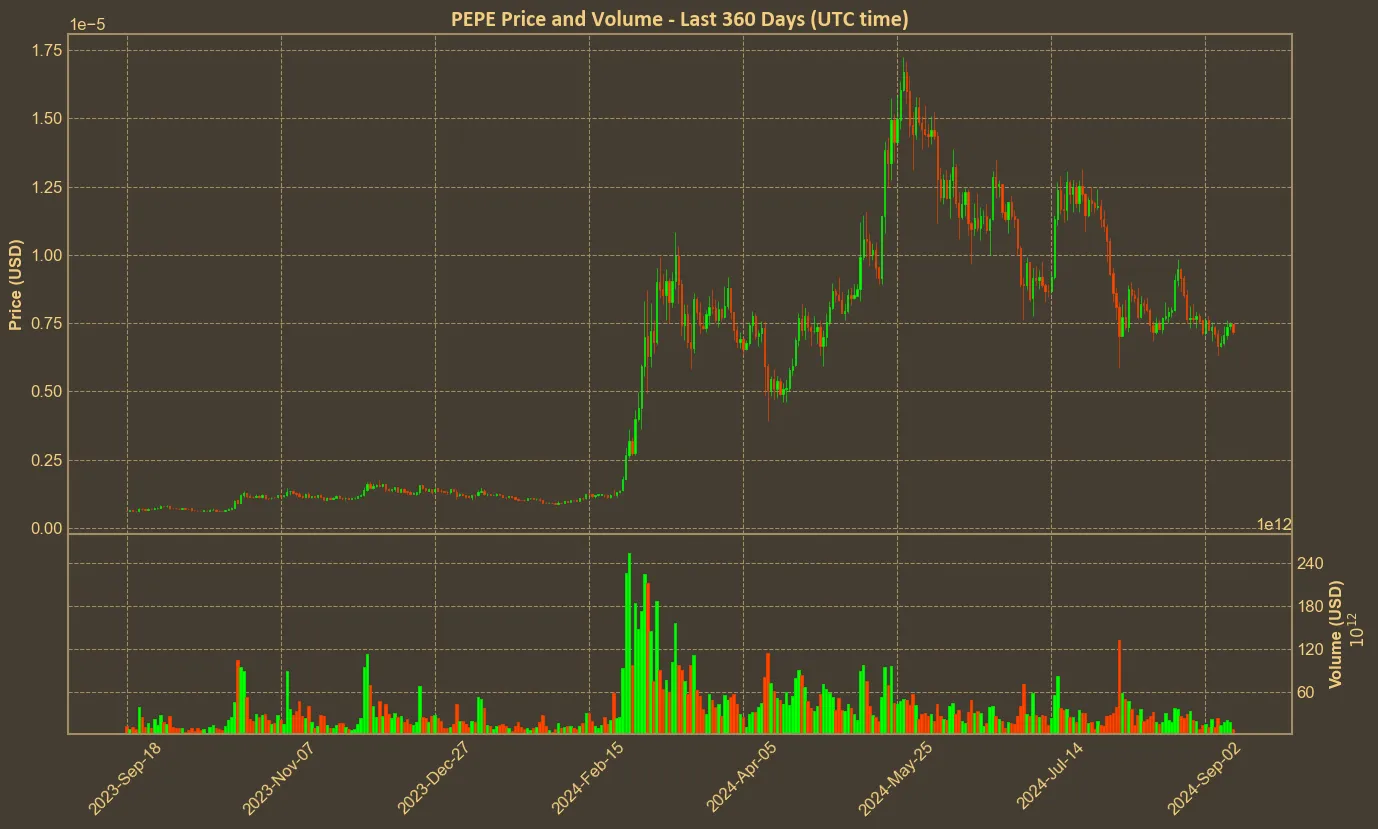
Recent data portray a mixed picture for PEPE. The token is currently ranked #28 in the cryptocurrency market with a price of $0.00000718. Its price forecast has shown significant swings over different periods, hinting at a complex market sentiment. Still, over the past year, PEPE has experienced an astronomical rise of 932.38% – that’s despite being down more than 50% from its all-time high in March!

Recent Trends and Indicators
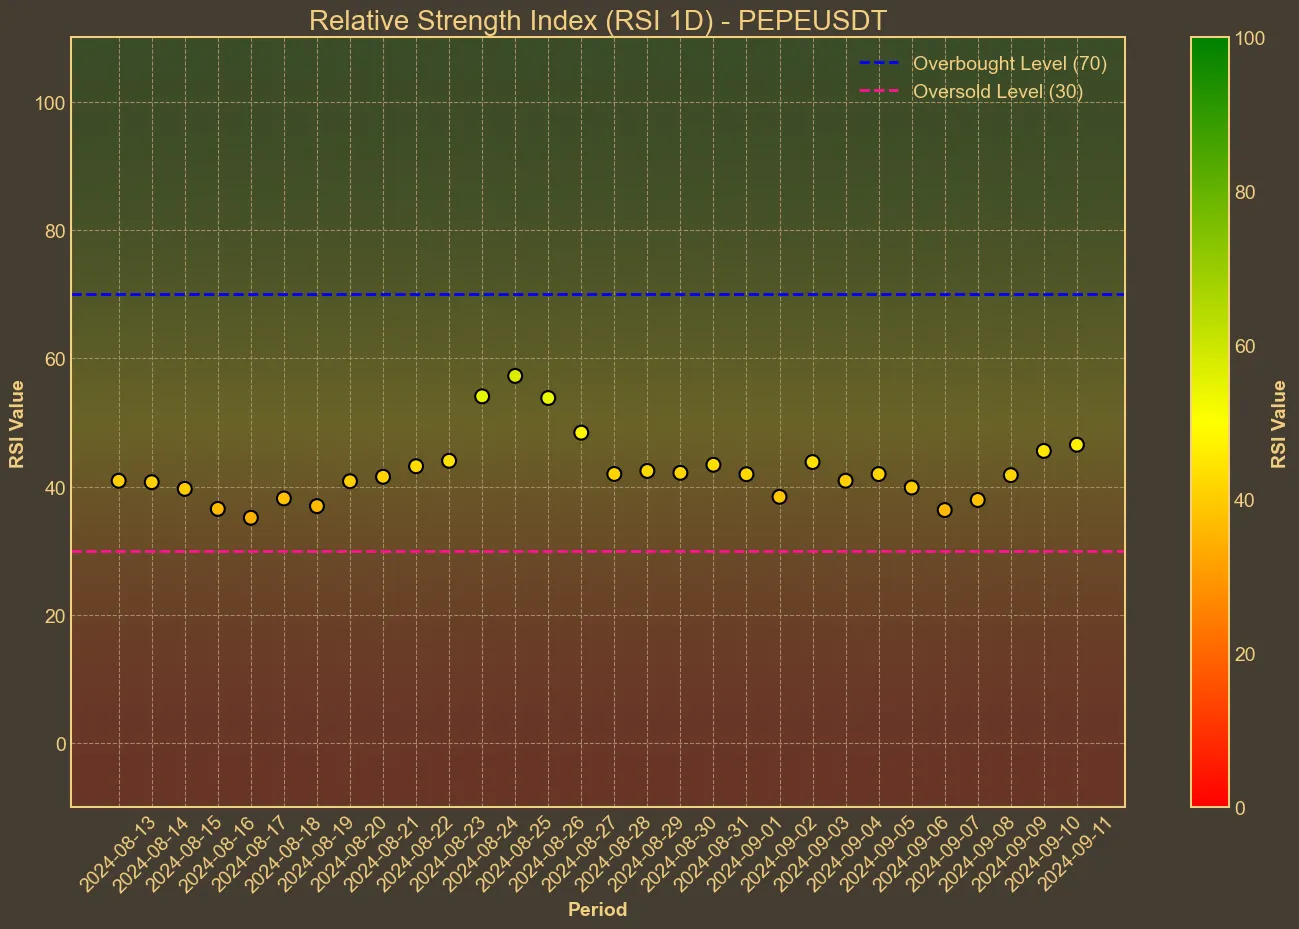
Analyzing the recent trends, PEPE’s market behavior has demonstrated both potential opportunities and cautionary signals. The price has decreased by 4% over the last day and 14% over the past month, suggesting some bearish tendencies. In a broader scope, the last quarter has seen a decline of 43%, which may concern short-term traders. However, the Weekly Relative Strength Index (RSI) of 44 indicates that PEPE is neither overbought nor oversold, maintaining a middle-ground position.

The Moving Average Convergence Divergence (MACD) has also been in negative territory, along with the Awesome Oscillator (AO) showing a similar trend. Both indicators point to possible bearish momentum, which savvy traders may need to monitor closely. On a positive note, the Bollinger Bands suggest a potential price stabilization as the price approaches the lower band. This could signify an imminent reversal or at least a period of less volatility.
Market Volumes and Capitalization
Pepe’s market dynamics are strongly influenced by changes in trading volume and market cap. The current market cap is $2.97 billion, with a trading volume of $0.42 billion. These figures have been relatively stable in the short run, despite market fluctuations. However, the volume has dropped notably over the last 30 days by 52%, indicating a reduction in trading activity. This suggests that while PEPE remains a popular asset, investor enthusiasm may be waning.
This dip in volume correlates with the observed price and market cap declines, and it underscores the interconnected nature of these metrics. Lower trading volumes often lead to less liquidity and can amplify price swings, both up and down. Therefore, traders should keep an eye on volume trends as an early indicator of market shifts.
Can PEPE overtake SHIB?
Currently, PEPE is the third-largest meme coin by market cap, while SHIB occupies the second spot with a market cap that is 259% larger. For PEPE to surpass SHIB without any change in SHIB’s price, PEPE would need to almost triple in value and set a new all-time high.
PEPE’s third-place ranking appears secure for now. The fourth-largest meme coin, WIF, has only half PEPE’s market cap, while BONK and FLOKI trail with market caps that are almost three times smaller. However, the market can shift rapidly, particularly with the unpredictable nature of meme coins. Earlier this year, we witnessed multiple days when PEPE and other meme coins surged by over 20%, illustrating how quickly the landscape can change.
Conclusion
PEPE continues to hold a prominent place in both the broader cryptocurrency and meme coin markets. While its recent performance suggests caution, its long-term gains have been impressive. Technical indicators like the RSI, MACD, and AO point to short-term bearish trends, though PEPE’s yearly performance remains strong. Investors should remain aware of the limitations of technical analysis, recognizing that while these tools provide valuable insights, they are not foolproof predictors of future price movements.


