Ripple’s XRP has taken a noticeable hit over the past week, dropping more than 12%. That’s one of the steepest declines among major cryptocurrencies in recent days. While the broader market is under pressure due to escalating trade tensions, XRP’s fall stands out.
The timing is surprising: just last week, the SEC dropped its appeal against Ripple, putting an end to years of legal uncertainty. Normally, that kind of regulatory clarity would trigger further gains. But for now, the market seems to be focused elsewhere.

At the moment, XRP trades at $2.11 with a market cap of $122.5 billion. That’s still a strong position – ranking fourth among all cryptocurrencies – but the short-term trend has clearly weakened. Market cap dropped over 10% in the past week, while trading volume has shrunk 38% in the last 30 days, showing reduced buying enthusiasm. So what can the indicators tell us about where XRP is headed?
Table of Contents
Momentum Indicators
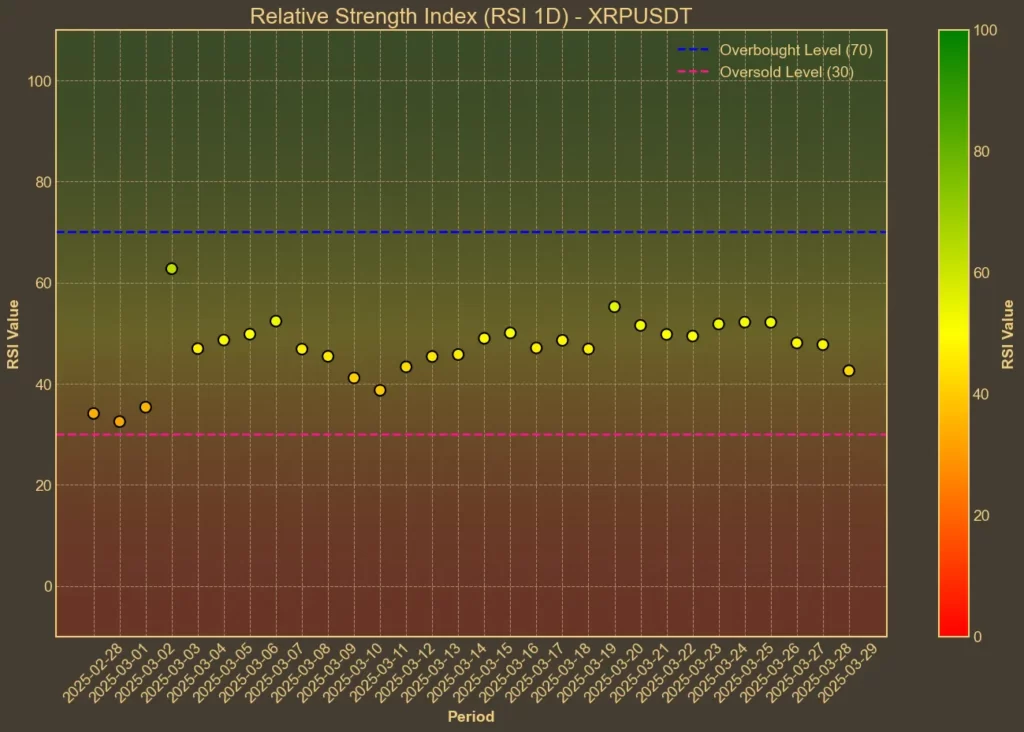
RSI: Oversold
The Relative Strength Index is now at 39 on the 14-day scale – down from 43 yesterday and 49 a week ago. On the shorter 7-day timeframe, the RSI has plunged to 26, signaling strongly oversold conditions. This suggests that selling may be overextended in the short run, potentially setting up for a rebound, but the overall momentum remains weak.

MFI: Bearish
The Money Flow Index, which includes volume in its calculation, has followed a similar path. It fell to 38 from 43 yesterday and 57 a week ago. This reflects fading buying pressure and points to continued caution among market participants.
Fear & Greed Index: Fear
Market sentiment is clearly risk-averse. The Fear & Greed Index dropped to 26 today, down sharply from 44 just yesterday. It’s now at one of its lowest points this month, suggesting that investors are more focused on capital preservation than speculation.

Moving Averages
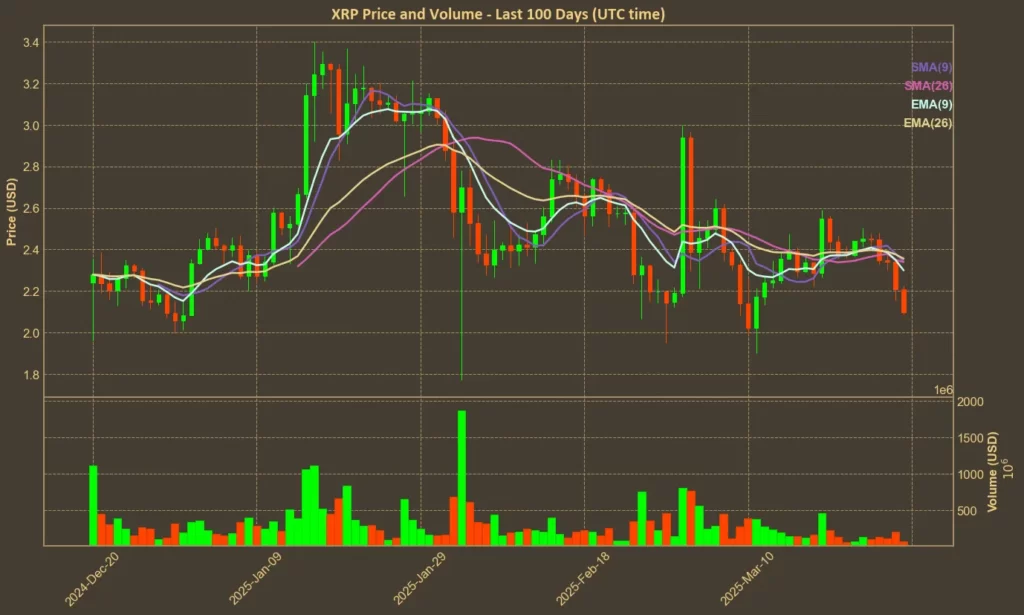
SMA & EMA: Bearish
XRP is currently trading below all key moving averages. The short-term SMA(9) and EMA(9) are at 2.34 and 2.3, while the longer-term SMA(26) and EMA(26) are both higher at 2.34 and 2.36. The fact that the current price is under every average confirms that the recent downtrend is not just a short blip.

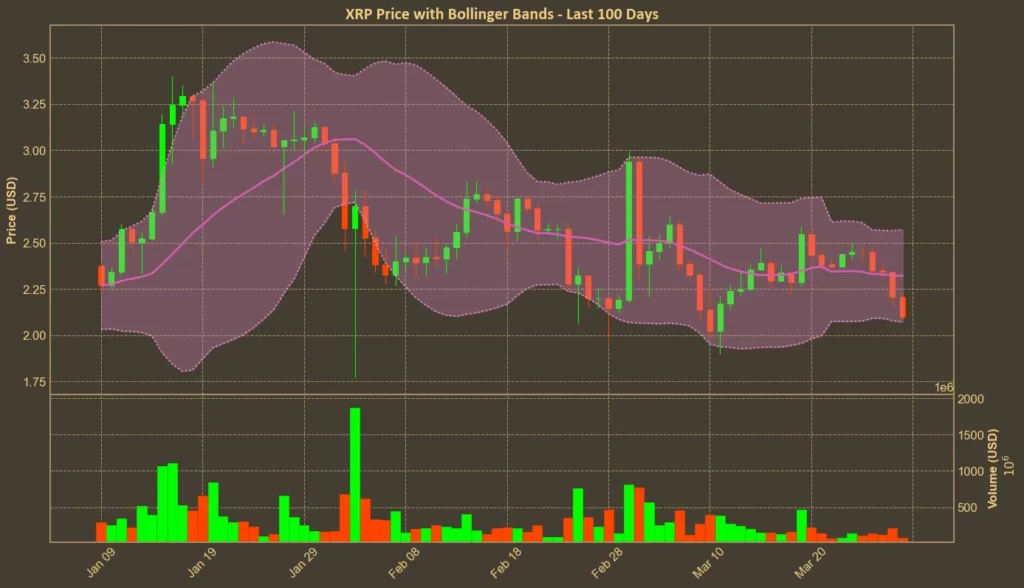
Bollinger Bands: Increased Volatility
Bollinger Bands show the price is nearing the lower boundary at 2.07. This suggests a possible oversold setup, but also highlights elevated volatility. If the price fails to stabilize near this level, it could open the door for further losses.

Trend & Volatility Indicators
ADX: Weak Trend
With an ADX reading of 13, trend strength is minimal. This doesn’t mean prices can’t fall further – but it does suggest the market lacks conviction in any direction. Consolidation or erratic price moves are more likely in the near term.
ATR: Low Volatility
The ATR stands at 0.16, unchanged from yesterday, and lower than a week ago. This drop in volatility, combined with weak trend strength, shows that the current correction lacks momentum. For now, sellers dominate – but they’re not pushing with full force.
AO: Bearish
The Awesome Oscillator slipped back into negative territory, reading -0.02 today. That’s a reversal from yesterday’s positive 0.03. It’s a small move, but it tilts the balance toward further downside risk, especially if no bounce happens soon.
VWAP: Bearish
With the VWAP at 2.59 – well above the current price of 2.11 – it’s clear that most recent trades happened at higher levels. This can act as resistance if buyers try to step in again, making a quick recovery less likely.
Relative Performance
Comparison Against ETH: Weakening
XRP has lost ground against Ethereum this past week, with the XRP/ETH ratio dropping over 6%. Despite rising 16% over the last month, the current weekly trend is negative. This relative underperformance signals reduced investor preference for XRP in the short term.

Summary
Technically, XRP is entering oversold territory. But that doesn’t mean a rebound is guaranteed. Most indicators point toward weakening momentum and low trend strength. A lot of traders are stepping to the sidelines, waiting for a clearer signal.
It’s even more frustrating for XRP holders considering recent headlines. The SEC appears to be pulling back from enforcement actions in other crypto cases, and Ripple just wrapped up its legal battle with a $50 million fine – far less than expected. These developments should be bullish, yet the market is focused on macro risks instead.
All things considered, XRP’s indicators show potential for a technical bounce, but also reflect a fragile setup. If buyers return soon, the price could stabilize. If not, support around the psychological $2.00 level may be tested. As always, technical analysis works best when used alongside news and sentiment – not as a crystal ball. At this point, XRP is caught between strong fundamentals and a cautious market mood.


