XRP has been hovering near the $2 mark for several days, struggling to build momentum after its sharp rally earlier this year. While the price hasn’t moved much in recent hours, the bigger picture shows clear signs of uncertainty. XRP is still among the strongest performers over the last 12 months, but recent dips and falling volume suggest traders are waiting for a clearer signal before making their next move.
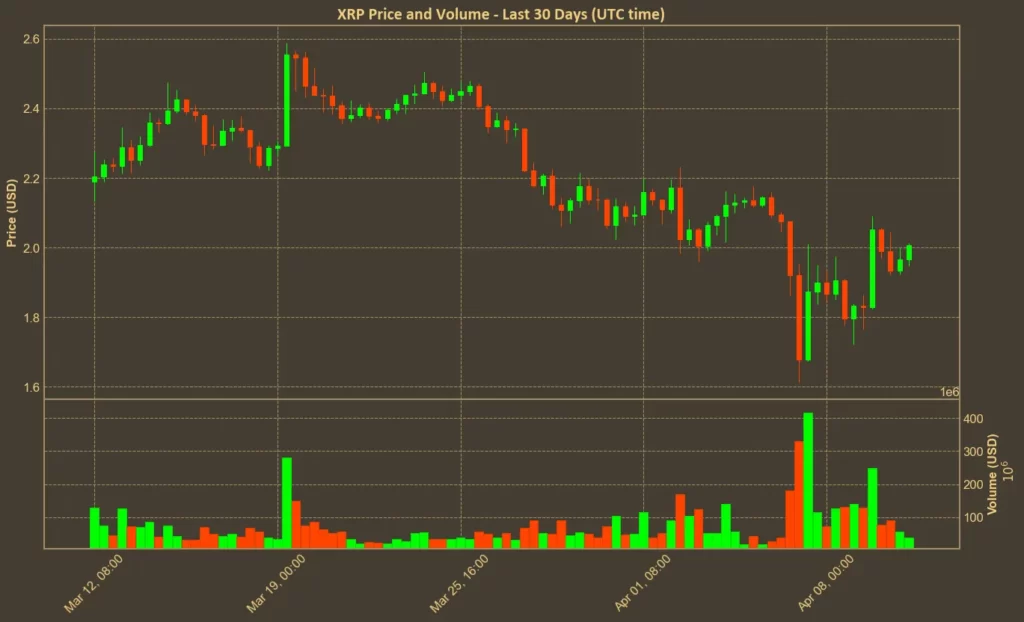
Table of Contents
Momentum Indicators
RSI: Neutral
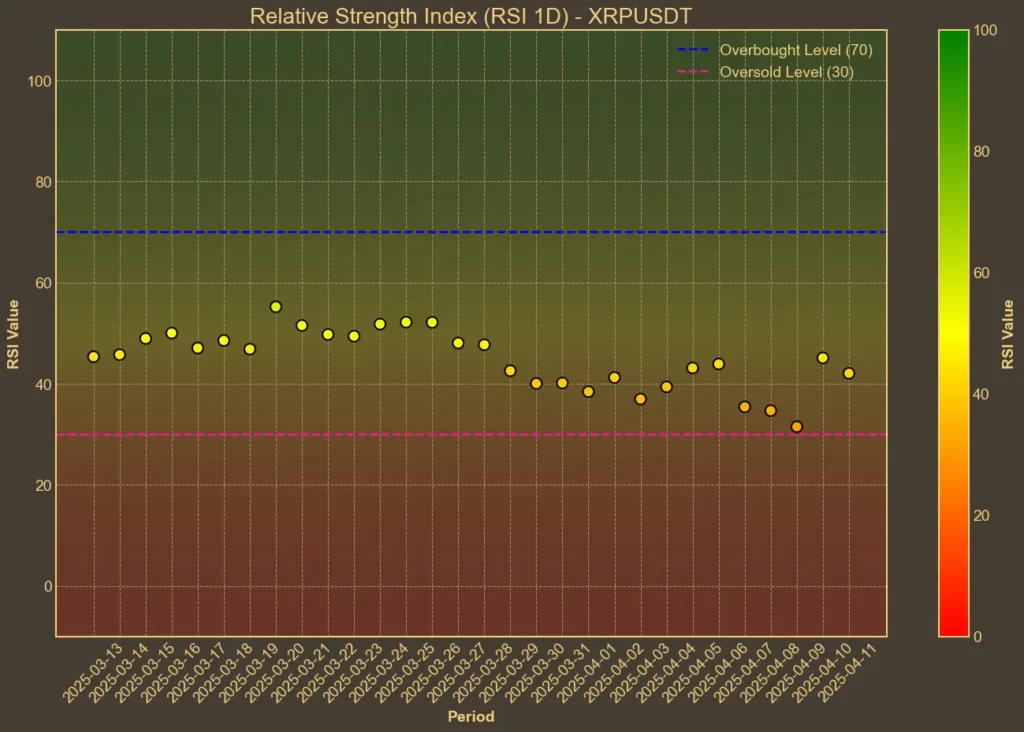
The Relative Strength Index gives us a glimpse into short-term sentiment. Right now, both the standard 14-day RSI and the shorter 7-day version suggest neither buyers nor sellers have the upper hand. RSI(14) stands at 44, slightly up from yesterday’s 42. RSI(7) rose more sharply to 47 from 43 – a small but visible attempt to bounce, although not yet convincing.
MFI: Recovering
The Money Flow Index – which combines price and volume – is painting a more optimistic picture. MFI(14) has moved from a weak 33 one week ago to 46 today. This steady climb could suggest that while price hasn’t reacted yet, capital is beginning to return. If the trend continues, it might set the stage for a stronger recovery attempt.
Fear & Greed Index: Fear
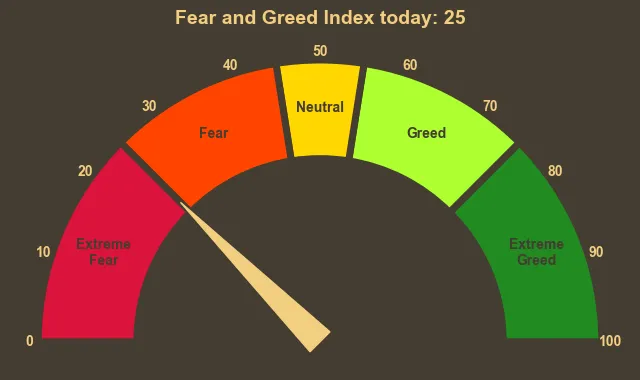
While XRP-specific sentiment is hard to quantify, the general crypto mood still leans toward caution. The crypto Fear & Greed Index currently reads 25 – close to the extreme fear zone. That’s a noticeable drop from the 39 recorded just yesterday. The mood among traders has turned more defensive again, likely tied to geopolitical tensions and macroeconomic pressure.
Read also: How To Use Crypto Fear and Greed Index To Your Advantage?
Moving Averages
SMA & EMA: Bearish
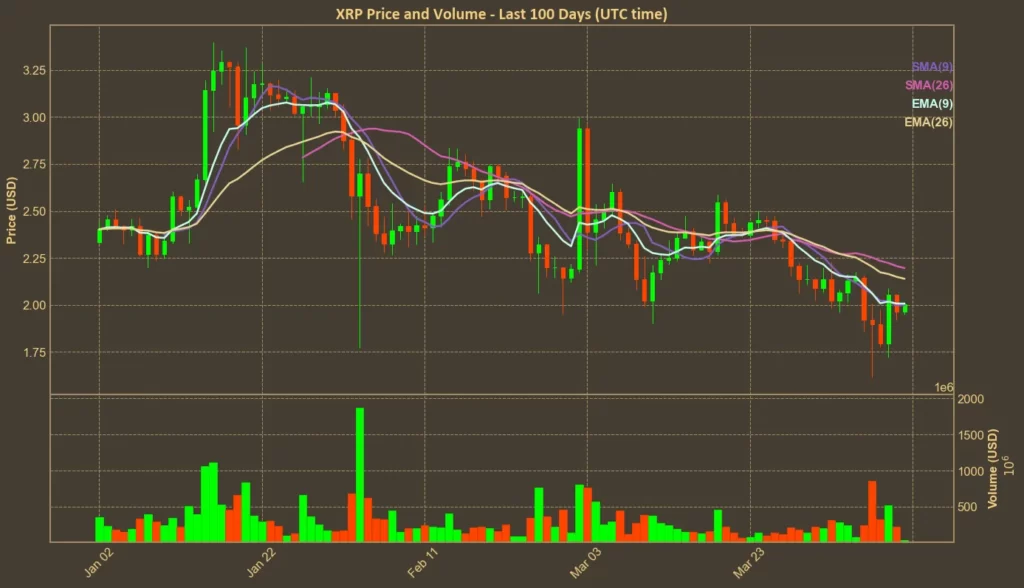
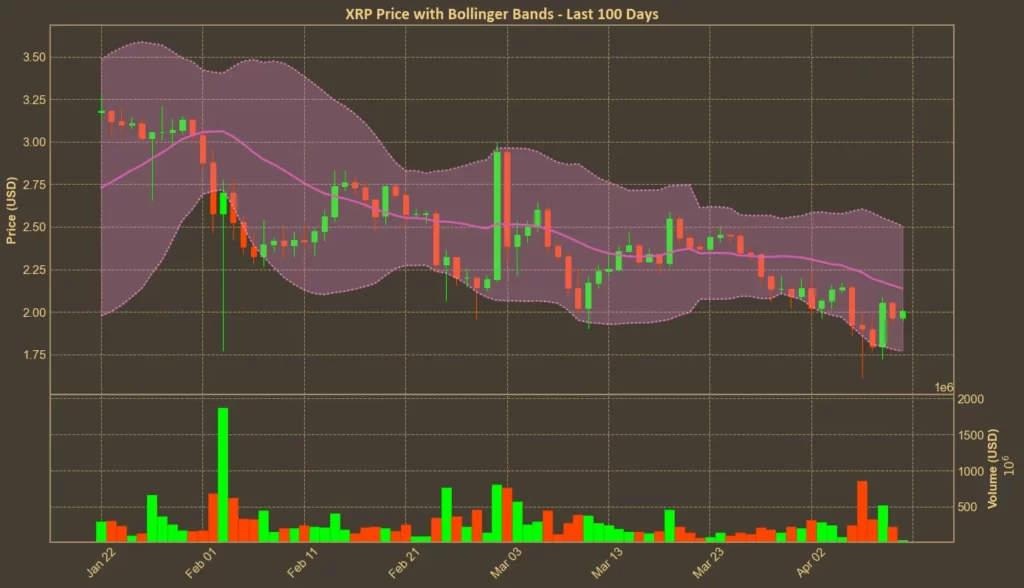
Short-term averages are flat, but longer-term ones are pulling away from the current price. SMA(9) and EMA(9) are both around $2, showing no immediate momentum. But the 26-day SMA sits at 2.2 and EMA at 2.14 – a gap that reinforces the idea that recent declines haven’t been reversed. As long as XRP trades under these levels, upward pressure will stay limited.
Bollinger Bands: Neutral
XRP is trading between the Bollinger Bands, which currently range from 1.77 to 2.5. The price is almost in the middle. That means there’s no breakout signal for now. Volatility is present but not extreme. Traders might see this as a waiting zone – watching to see which direction gets tested next.
Trend & Volatility Indicators
ADX: Strengthening
ADX at 25 means the trend is gaining strength. That’s up from 17 a week ago, and shows that momentum – while still moderate – is no longer flatlining. The trend direction, however, is not clearly bullish or bearish. We’re seeing movement, but not commitment.
ATR: Stable Volatility
The Average True Range sits at 0.18. That’s lower than yesterday, but slightly higher than last week. In simple terms, price swings are slightly elevated, but not out of control. Traders are active, but they’re not rushing in or out.
AO: Bearish
The Awesome Oscillator is still negative, sitting at -0.29. It suggests that bearish momentum hasn’t fully faded. While it’s slightly better than a week ago, there’s no clear reversal yet. This will need to flip before the bulls can gain real control.
VWAP: Overextended
VWAP at 2.57 is well above the spot price. This confirms that XRP is trading below its average weighted by volume – often a sign of weakness. It might also suggest limited buying interest at higher prices, unless volume returns strongly.
Relative Performance
Comparison Against BTC: Underperforming
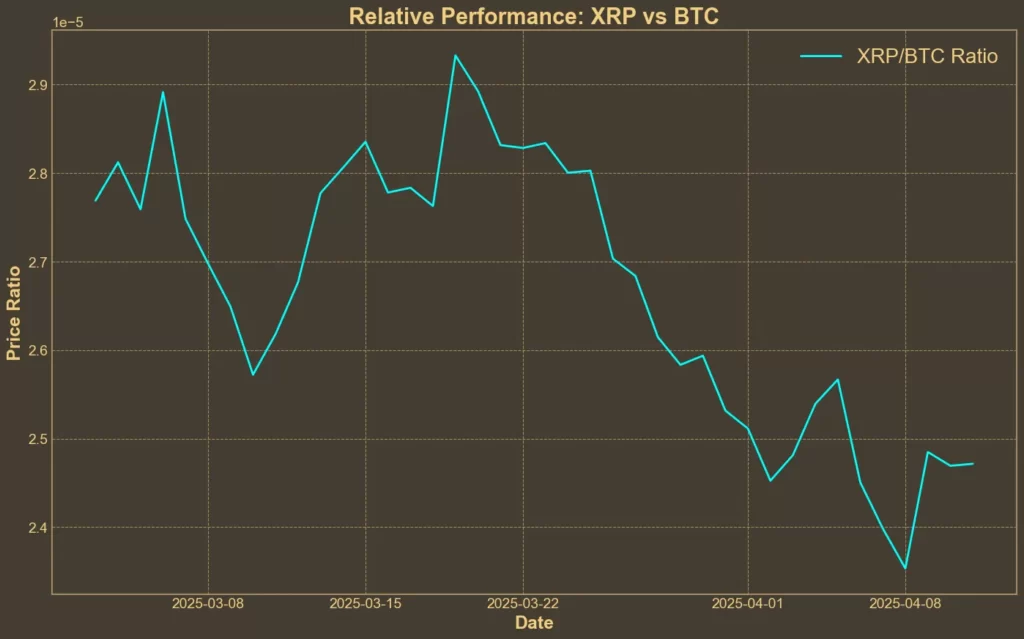
XRP is losing ground against Bitcoin. The XRP/BTC ratio fell by 2.6% over the past week and nearly 11% in the last month. Bitcoin has been holding up better than most assets recently, and BTC dominance is near its highest level in years.
What Else Is Driving XRP?
XRP’s recent slowdown is partly tied to broader macro pressure. While Trump has paused most new tariffs for 90 days to allow negotiations, the uncertainty hasn’t gone away. Tariffs on Chinese imports remain in place – now raised to a steep 145% – and markets are still cautious. XRP had a strong start to the year, but like many altcoins, it’s now reacting to forces well outside the crypto space.
At the same time, the recent launch of 2x leveraged ETF (XXRP) shows there’s institutional interest in XRP exposure – even if it’s speculative. However, it’s not a spot ETF, so the long-term impact on price may be limited.
Read also: XRP’s First ETF Launches – But The Price Drops Anyway
Conclusion
Most technical indicators show mixed signals. RSI and MFI are stable or rising, but the Awesome Oscillator remains negative and XRP is under key moving averages. Trend strength is picking up, but the direction is unclear. While some data points – like the MFI and ADX – hint at building momentum, others suggest the coin is still searching for direction.
It’s also important that technical analysis can be helpful in identifying trends, but it doesn’t factor in unexpected news or sudden shifts in investor mood. With tariffs, ETFs, and global sentiment all moving fast, charts might be just one piece of a much bigger puzzle. For now, XRP is holding its ground – but to break higher, it needs more than just technical support. It needs volume, confidence, and a reason to move.
Need a quick and easy way to see what’s happening in crypto over the next few days? Check out our Crypto Events Calendar!


