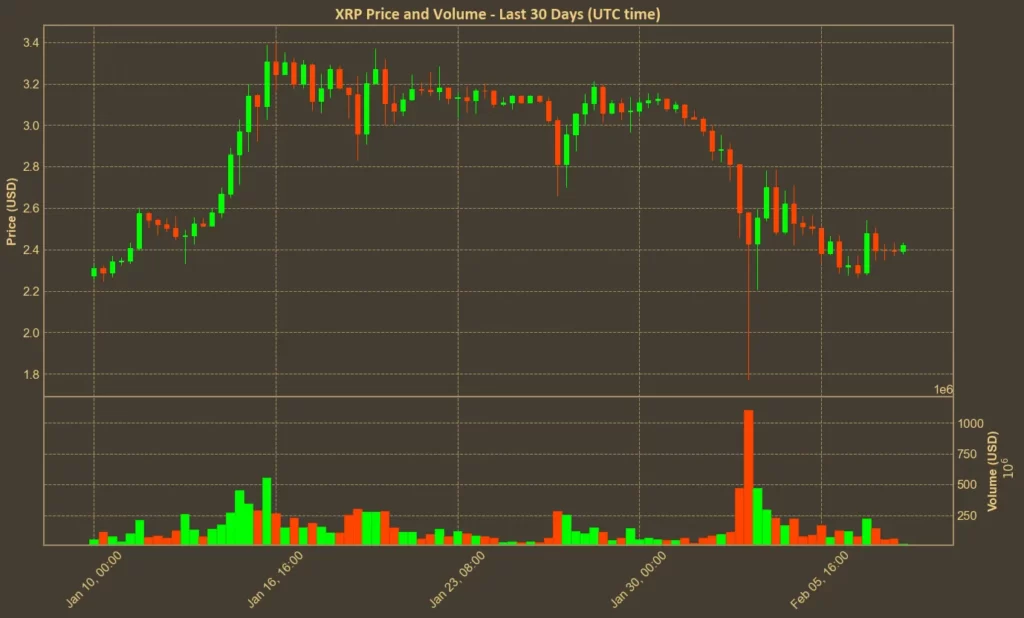
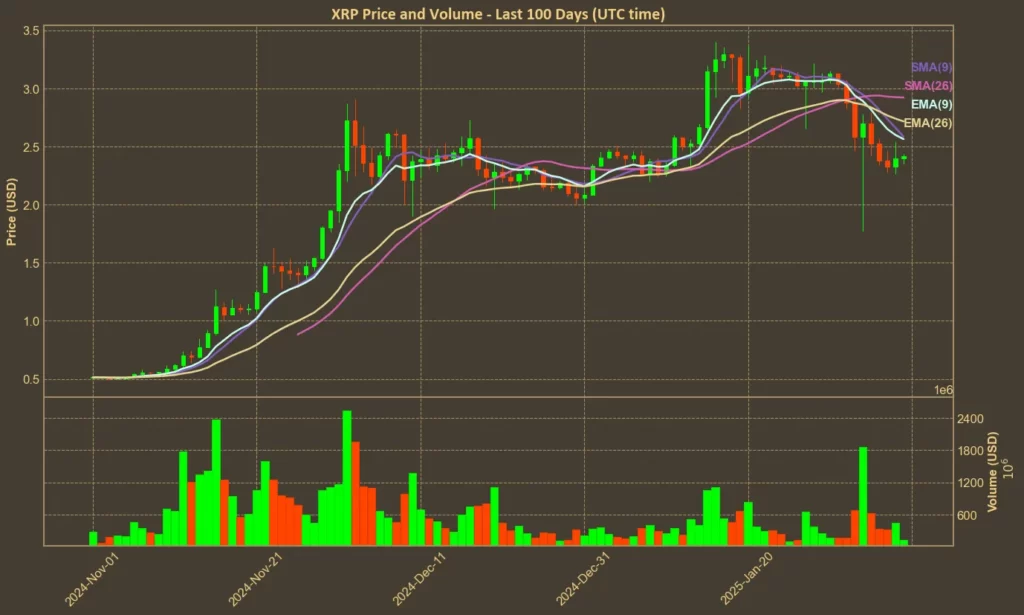
Ripple’s XRP is facing a rough week, despite optimistic headlines about potential ETF approvals. The token has plunged nearly 18% over the past seven days, currently trading at $2.42. This decline has also seen XRP lose its spot as the third-largest cryptocurrency by market cap, with USDT now holding a slight edge.
That said, the long-term outlook for XRP remains promising. One of the biggest catalysts is the expectation that XRP ETFs will receive regulatory approval this year, a development that could drive significant institutional inflows. Additionally, Ripple is preparing to launch XRP Depository Receipts (DRs), which would provide institutions with a regulated way to gain exposure to XRP without trading on exchanges. Adding to the speculation, rumors suggest that Ripple’s CEO, Brad Garlinghouse, is being considered for a role in the White House Crypto Council.
Yet, in the short term, XRP’s performance has been lackluster. Are these bullish developments enough to spark a rebound? Could we see a return to the $3 level in the coming days? To answer these questions, we’ve conducted a technical analysis of XRP’s price action.
Table of Contents
Momentum Indicators
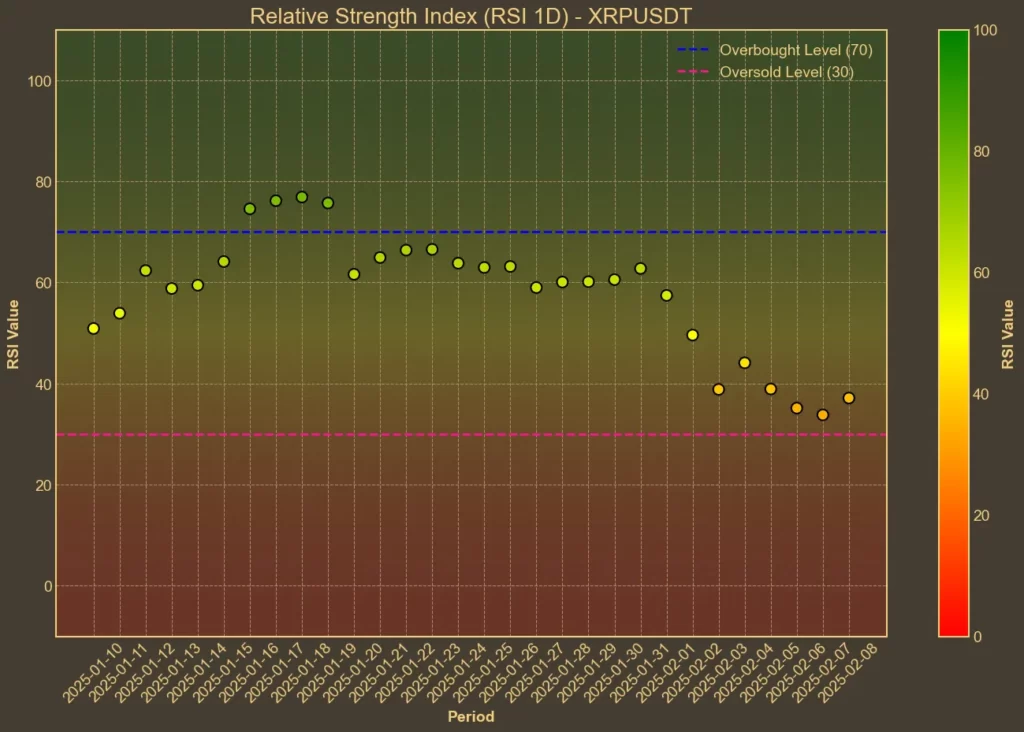
RSI: Becoming Oversold
The Relative Strength Index (RSI), which tracks overbought and oversold conditions, is currently at 38 -down significantly from 50 a week ago. Short-term RSI (7) sits at 30, on the edge of oversold territory. This suggests selling pressure has been dominant, but also that a potential bounce could be on the horizon.
MFI: Bearish
The Money Flow Index (MFI), which incorporates volume into momentum analysis, stands at 28, down from 49 just a week ago. This confirms that selling pressure has been strong and that XRP lacks strong inflows at the moment.
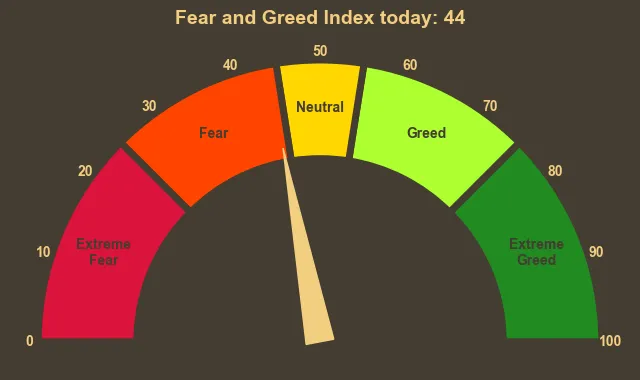
Fear & Greed Index: Neutral
The broader crypto market sentiment has cooled in recent days. The index reads 44, suggesting investors are cautious but not in full panic mode. Notably, this is a sharp decline from last week’s 68, when optimism was much higher.
Moving Averages
SMA & EMA: Bearish
The short-term moving averages remain below the longer-term ones, signaling a bearish trend. The price trading below both SMAs and EMAs suggests momentum is still to the downside.
Bollinger Bands: High Volatility
Bollinger Bands show that XRP’s price is moving closer to the lower band at 2.26, indicating oversold conditions. The upper band sits at 3.47, leaving room for a potential rebound if buyers step in. However, the widening bands suggest that volatility is increasing.
Trend & Volatility Indicators
ADX: Stronger Bearish Trend
The ADX(14) at 32 indicates that the current downtrend is gaining strength. This is a notable increase from last week’s 17, showing that sellers remain in control.
ATR: High Volatility
The ATR(14) at 0.27 reflects increased volatility. While XRP has seen strong trends before, the recent spike suggests continued price swings in the short term.
AO: Bearish Momentum
The Awesome Oscillator (AO) is currently at -0.34, confirming negative momentum. This aligns with the ongoing price decline.
VWAP: Below Average
XRP is trading well below its VWAP of 1.99, further reinforcing the bearish short-term outlook.
Relative Performance
Comparison Against BTC: Weakening
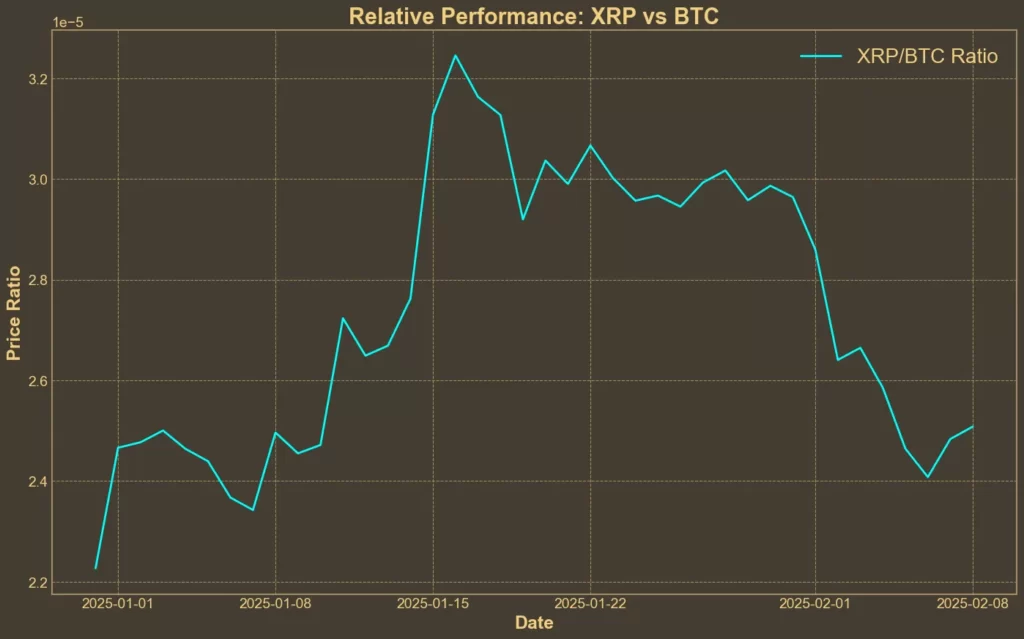
The XRP/BTC ratio has declined by 12.27% over the last week, reflecting XRP’s underperformance relative to Bitcoin. Over the last 30 days, the ratio has increased slightly by 1.50%, but the short-term trend is clearly bearish.
Final Thoughts
Technical indicators present a mixed picture for XRP. While momentum and trend indicators remain bearish, the RSI and Bollinger Bands suggest that the token is approaching oversold conditions, making a short-term bounce possible. However, for any meaningful recovery, XRP needs fresh buying interest – something that has been lacking recently.
Despite a strong long-term case boosted by potential ETF approvals and institutional adoption, the short-term outlook remains uncertain. If XRP can reclaim key moving averages and hold above $2.50, a rebound could gain momentum. Otherwise, further declines toward the $2.20–$2.30 range remain likely.
So far, bullish news alone hasn’t been enough to shift market sentiment. However, a stronger catalyst—such as an official ETF approval – could provide the spark needed for a breakout rally. It’s also crucial to remember that technical analysis can’t account for unexpected market events, which may also play a role in determining XRP’s next move.
Need a quick and easy way to see what’s happening in crypto over the next few days? Check out our Crypto Events Calendar!

