Bitcoin has hit a new all-time high in U.S. dollars once again, reaching $111,861 before easing slightly. That’s not just another milestone – it’s a confirmation of the trend that’s been building for weeks. The climb didn’t come from a single news event or sudden breakout. It was steady, supported by rising volume, growing confidence, and consistent inflows. And so far, the market isn’t backing off.
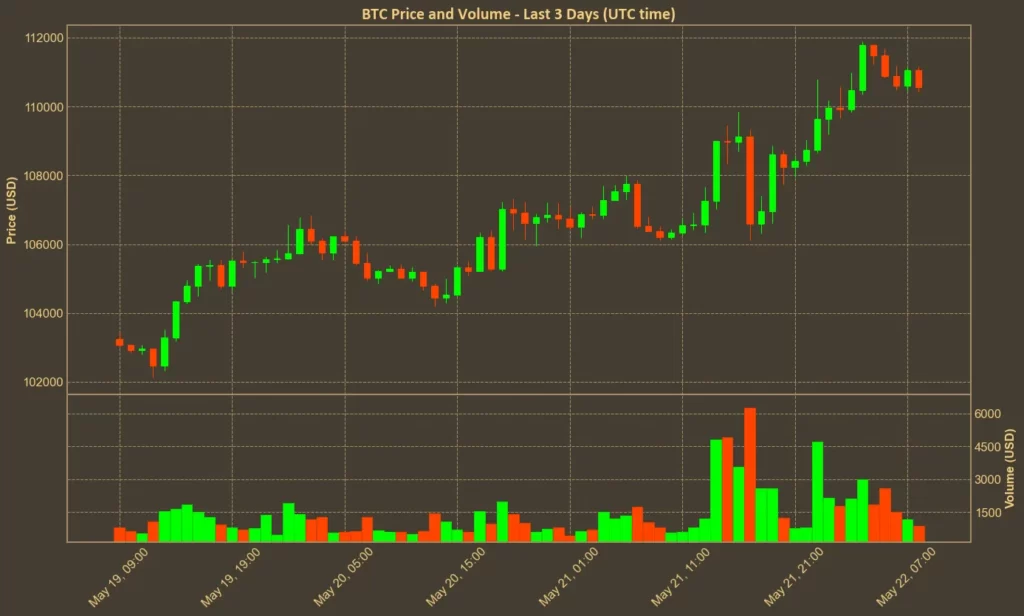
But it’s worth putting this move in context. While the dollar-based price is at record levels, the dollar itself has weakened noticeably. The U.S. Dollar Index has dropped from 109 in January to below 100 now. That matters because a weaker dollar makes assets like Bitcoin appear stronger. In euros, yen, or pounds, Bitcoin hasn’t broken its highs yet. It’s close – but not quite there.
Read also: Is Bitcoin Really Near Its ATH – Or Is the Dollar Just Weak?
Table of Contents
Click to Expand
Momentum Indicators
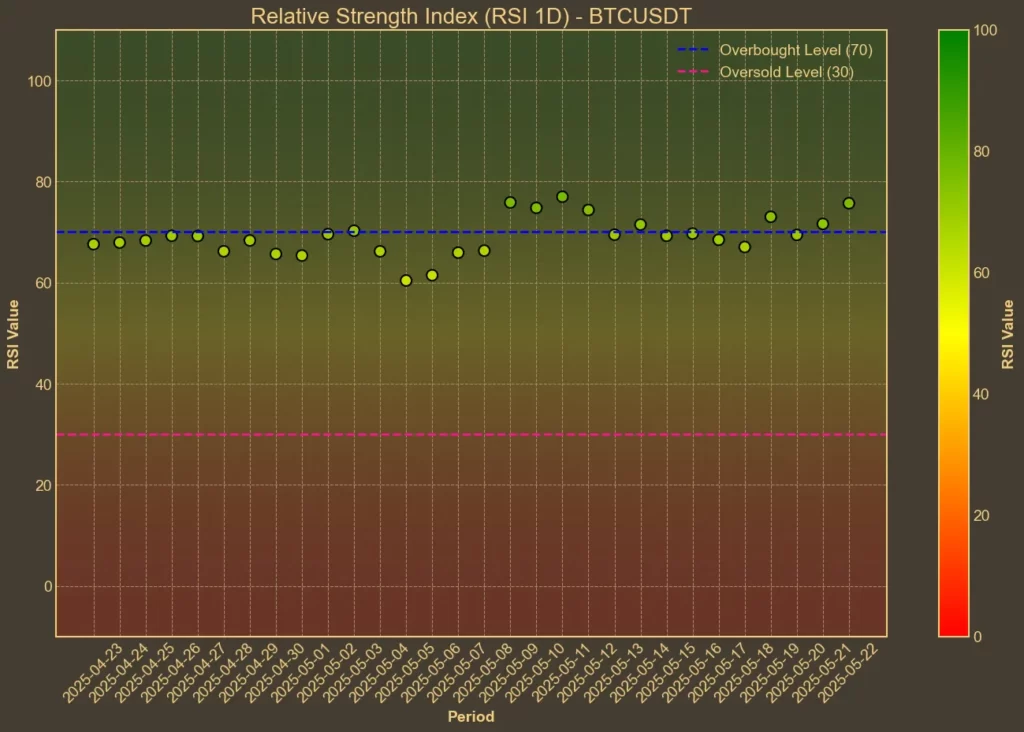
RSI: Overbought
The 14-day RSI is now at 77, and the short-term RSI(7) is even hotter at 83. This shows strong bullish momentum, but also raises the chance of a short-term cooldown. These levels have historically led to pauses or pullbacks, even in larger trends.
MFI: Bullish
The Money Flow Index is currently at 61. It’s supportive of the rally but not in extreme territory. That suggests the trend is still being driven by meaningful volume, not just late-stage hype.
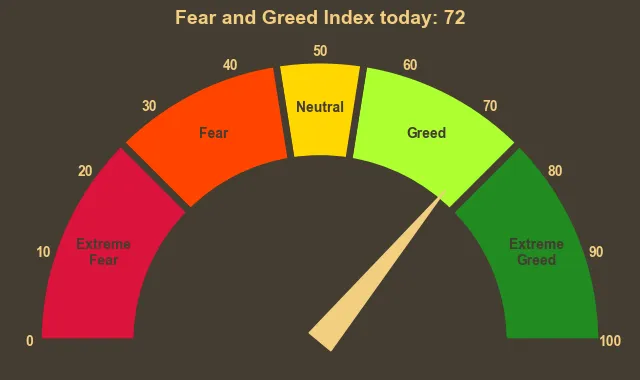
Fear & Greed Index: Greed
Sitting around 72, the market is clearly optimistic. Sentiment has held steady here for a week – high, but not overheated. If it pushes closer to 80, that’s when signs of FOMO might start to creep in.
Moving Averages
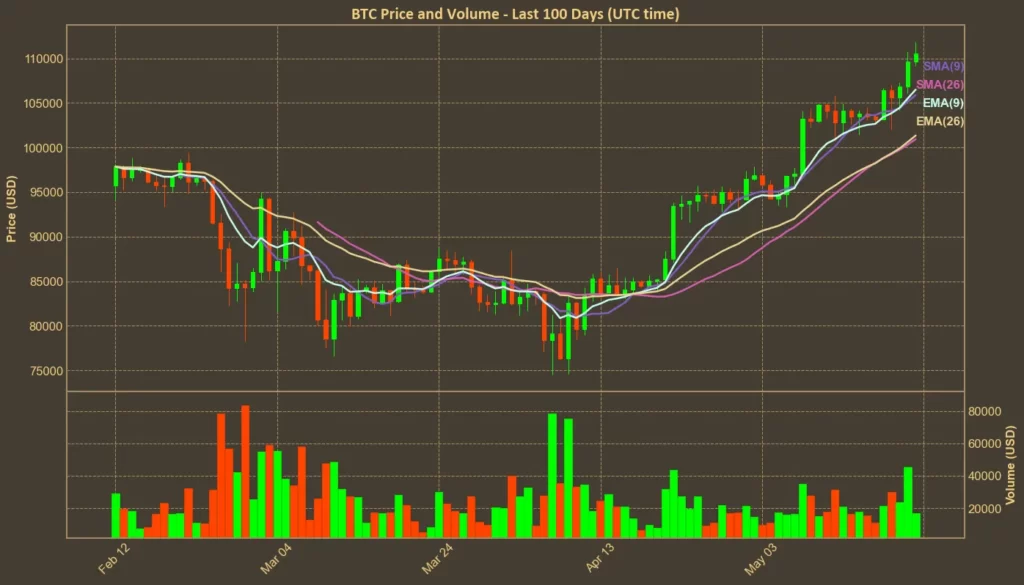
SMA & EMA: Bullish
Price remains well above the short-term averages. The EMA(9) is at $106,499, with the current price over $111,000. The structure of the chart is classic bullish – fast-moving averages above slower ones, with clear separation. That’s a good sign for continuation.
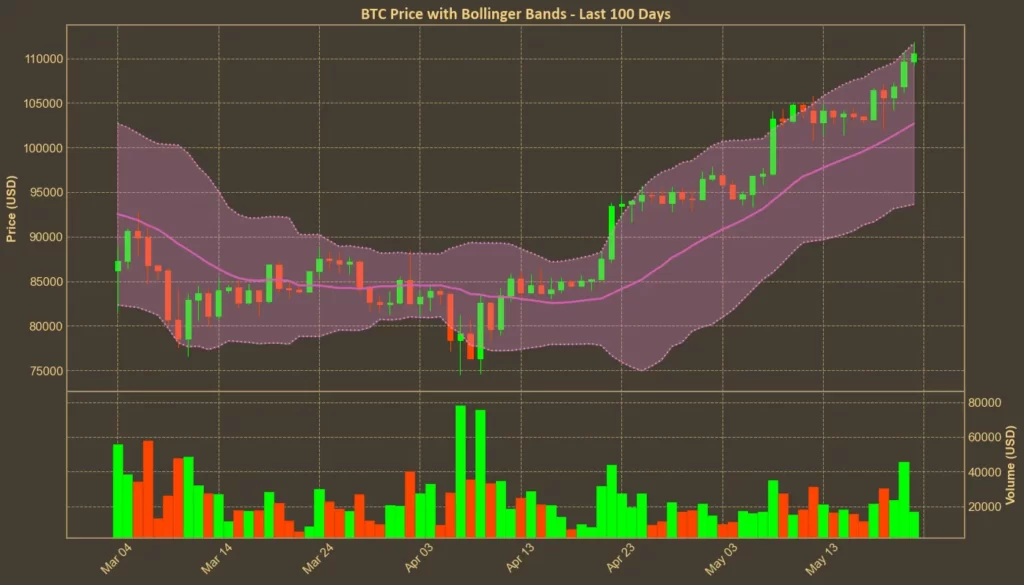
Bollinger Bands: Overbought
Price is right at the upper band, which sits near the ATH. This shows strong momentum but also warns of potential short-term resistance. When price rides the top of the band, it often signals one of two things: continuation or brief rejection.
Trend & Volatility Indicators
ADX: Strong
ADX is at 33 – solid confirmation that the trend is real and has strength behind it. It’s not extreme yet, which means there’s room for it to continue.
ATR: High Volatility
The ATR shows that daily price swings are large. That means opportunity, but also higher risk if the direction changes. It’s a reminder that gains can reverse just as quickly if sentiment flips.
AO: Bullish
The Awesome Oscillator is positive at 8720, although the momentum has slowed slightly from its peak. It’s still bullish – but it’s not accelerating anymore.
VWAP: Bullish
With VWAP at $89,564, the market is clearly trading above average weighted prices. This confirms buying strength and shows that the breakout is built on actual demand, not just leverage.
What It All Means
We’re in a strong uptrend. The price action confirms it, the indicators support it. Bitcoin has broken past its January highs and hasn’t pulled back sharply – the market seems ready to push through.
Still, the overbought signals – especially RSI and Bollinger Bands – suggest a short-term cooldown wouldn’t be out of place. That doesn’t mean a crash is coming – but it could mean a few days of sideways trading, or even a dip to test lower support, before the next leg up.
At the same time, part of this rally is driven by a weaker dollar. That doesn’t make it fake, but it does change how the move is perceived globally. In euros or pounds, Bitcoin isn’t quite at the top yet.
Read also: Why Not Staking Your Solana Might Be Costing You Money


