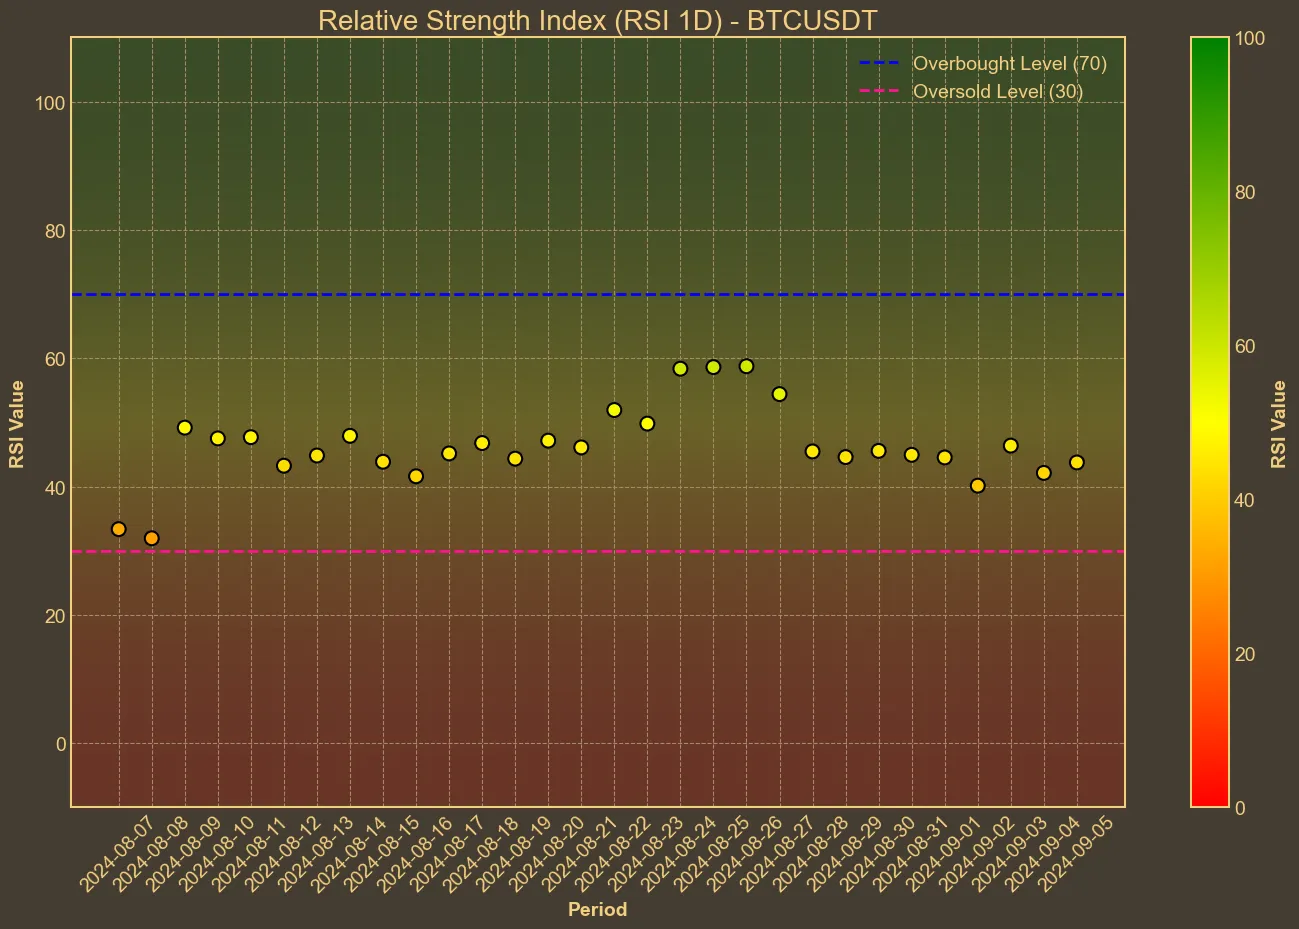
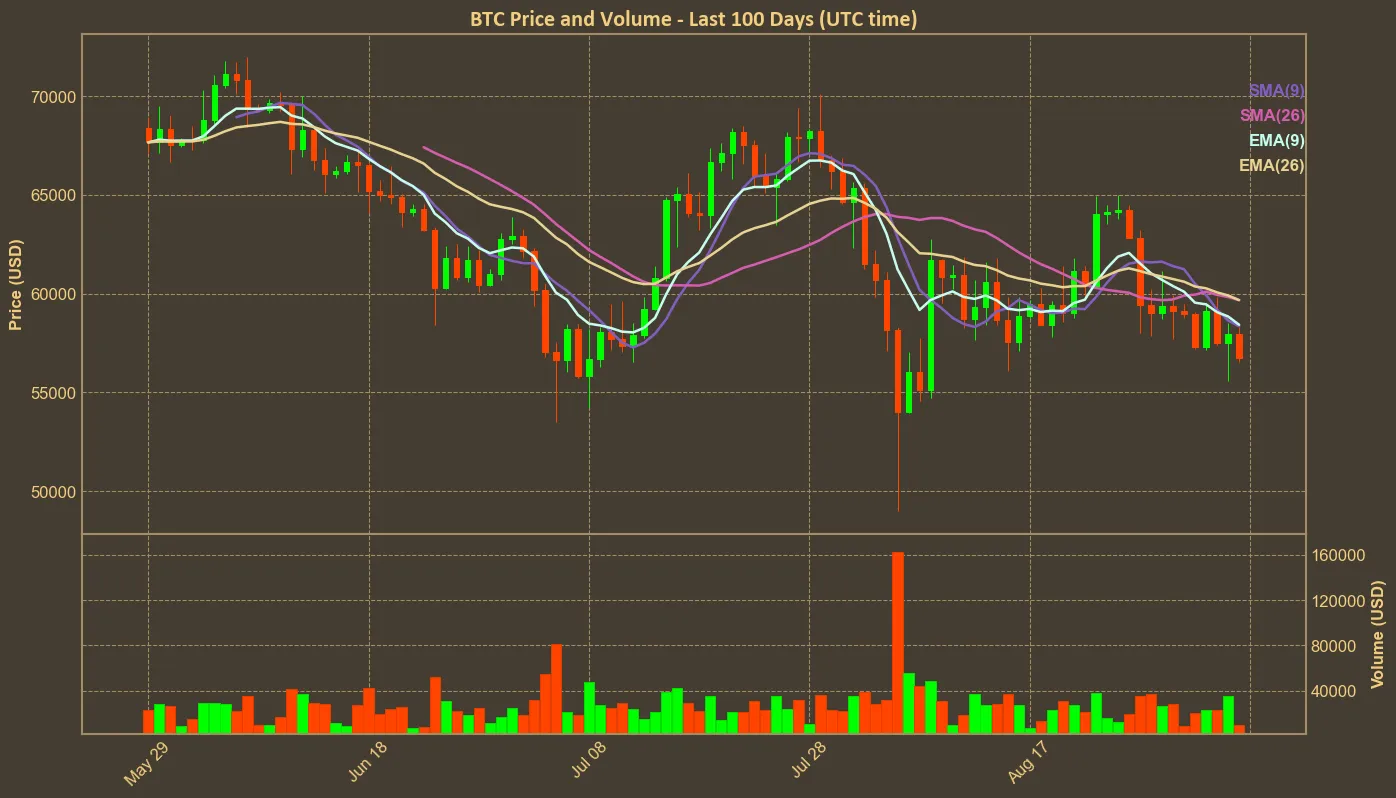
After a brief rally to the $58,000 range, Bitcoin has once again dropped, now trading at $56,768. The current market landscape reflects a complex interplay of various trends, signaling caution for the near future. Let’s break down the key technical indicators that are driving these shifts.
Key Technical Indicators Signal Weakness
The Relative Strength Index (RSI) is hovering around 41, placing it in bearish territory. Meanwhile, the Fear and Greed Index has dipped to 29, approaching the “Extreme Fear” zone. This confirms a generally bearish sentiment in the market, adding to concerns of a possible further downtrend in the short term.

On top of this, both the Simple Moving Average (SMA) and Exponential Moving Average (EMA) are positioned above the current price, reinforcing the ongoing downward pressure. Further momentum indicators, like the Moving Average Convergence Divergence (MACD) and the Awesome Oscillator (AO), also reflect a challenging market outlook. The MACD remains well below its signal line, while the AO continues to trend negative, indicating weak momentum and market strength. The Average True Range (ATR) highlights significant volatility, adding another layer of uncertainty to the short-term forecast.

Outlook and Considerations
The overall situation looks challenging, and the downturn in the broader stock market is only compounding Bitcoin’s struggles. However, it’s important to remember the limitations of technical analysis. These indicators can quickly shift in response to broader economic factors, policy changes, or shifts in market sentiment – especially during volatile times like the present.
While the signals currently suggest a bearish trend, Bitcoin could attempt another recovery soon, much like it did in recent days. The market remains highly dynamic, and a turnaround is always possible in the ever-volatile world of cryptocurrencies.


